
Alexander Vengerovsky, Chief Data Scientist
February 6th, 2023
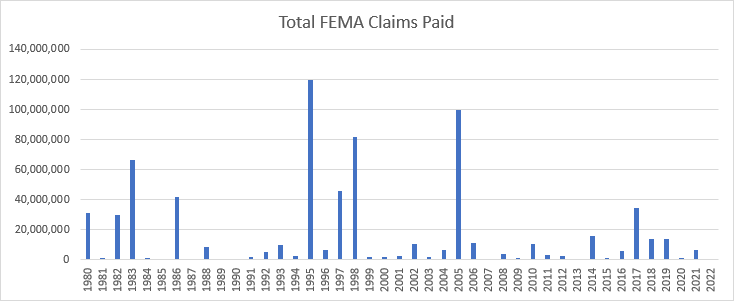
1986: The Napa River flood of 1986 is considered by many to be the worst flood experienced by Napa, California during the 20th century. With 20 inches of rain that fell in a 48 hour period; 7,000 people were evacuated, 250 homes were destroyed and another 2,500 damaged, 3 people died and totaled an estimated $100 million in overall damage.
1995: Storms during the 1995 El Niño winter caused extensive flooding along the central California coast. The Salinas River discharged 3 million tons of sediment per day. On March 12th, 1995, the largest flood in 100 years hit the central Monterey Bay area, affecting both the Salinas and Pajaro River systems. Flood waters flowed into low-lying areas that were part of the “wet corridor” before the river course was influenced by humans.
1997: Widespread flooding of streams, creeks and rivers caused extensive damage. The hardest hit towns were Klamath and Stafford. Klamath was flooded by the Klamath River which crested 11.22 feet above flood stage. Stafford was virtually wiped out by a mudslide. Other major rivers that flooded and their crests were: the Eel River near Scotia (3.97 ft above flood stage), Eel River at Fernbridge (5.22 above FS), Eel River at Miranda (0.64 above FS), Mad River at Arcata (3.46 above FS) and the Van Duzen River near Bridgeville (0.91 above FS). Numerous road closures due to flooding and mudslides. The Northwest Pacific Railway was closed due to extensive damage to sections of track.
2005: Widespread severe flooding affected many towns in Marin County including Fairfax, San Anselmo, Novato, Inverness, Ross and Mill Valley. Across the County, 1600 homes, 240 businesses and 225 government agencies were affected by the flood. San Anselmo was under 2 feet of water with an estimated 150 of its 250 businesses damaged and a price tag of around $40 million. Fairfax is looking at a $25 million tab and Ross around $13 million. An estimated 4 to 7 inches of rain fell on the County in a 24 hour period preceding the flood. The flooding continued into the first few days of January 2006.
Most impacted communities,
FEMA flood claims paid per household:
| Households | Total claims paid | Claims, $ per household | |
| Malibu | 5,168 | 47,041,000 | 9,100 |
| San Anselmo | 5,224 | 18,060,000 | 3,460 |
| Rio Linda | 4,962 | 9,131,000 | 1,840 |
| Scotts Valley | 4,779 | 8,478,000 | 1,770 |
The map shows the amount of paid FEMA flood related claims per household in Northern California from 1980 through December 2021.
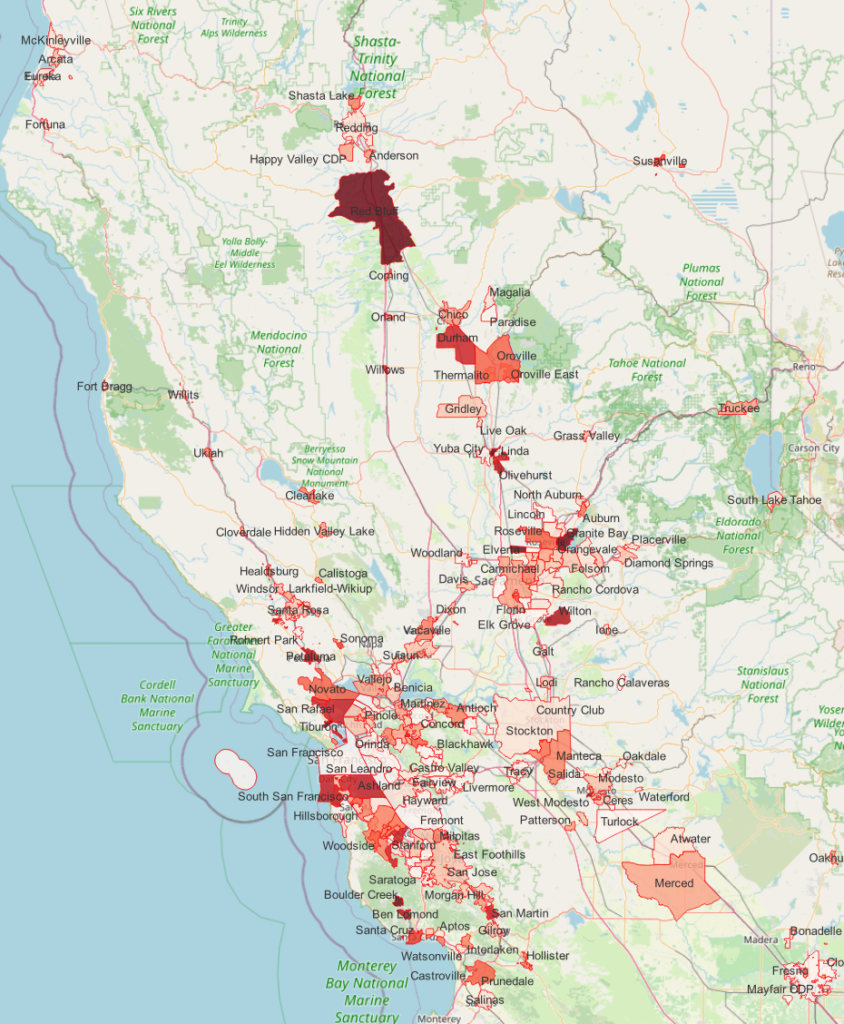
*All claim amounts are inflation adjust to January 1, 2022
About Spatial Risk Systems:
SRS is a data connectivity company focused on spatial finance. We have created a multi-tier data map showing where physical economic activity takes place on a global basis and have connected this to key risk factors and open data sets in the form of a knowledge graph.
Alex previously spent the past 12 years focused on all things data at the Westport, CT based hedge fund, Bridgewater Associates.
Spatial Finance is a way to unify geospatial-climate, socio-economic, entity relationship and other data sources to use for operational assessment, risk management, portfolio/index construction and variety of other business decisions. The resulting highly connected and consistent data structure is known as a Knowledge Graph.
Tags: SRS, Spatial Finance, Utilities, Knowledge Graph, Utilities Index
For more information, please visit SRS’s web site or email [email protected]