
INSIDE THE DATA - AN SRS DRILL-DOWN
PPP & the State of New Jersey
With help of SRS connected data and Knowledge Graph we can easily analyze PPP data and discover correlations with various socio-economic factors.
Focus: New Jersey
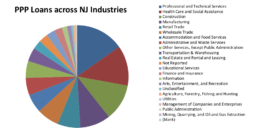
From the start of the program 160 thousands NJ businesses got PPP loans approved with the total value of $17.3B. The following chart shows the distribution of loans across state industry sectors. Almost half of the money were allocated to Professional Services, Healthcare and Social Services, Construction and Manufacturing. It is a bit surprising that Accommodations and Food Services (that where hotels and restaurants are) are somewhat lower in the pecking order given the devastating impact of COVID on these businesses. Maybe there is a good explanation for this.
To understand the relative impact of PPP program on people living in different NJ counties we connected PPP data set with available demographic data available in SRS. As you can see from the table below the largest loan amount per reported job (the job that would be either saved or hired into using PPP money) is in Somerset, Burlington, Morris and Somerset counties, whereas this figure is materially lower in Ocean and Cape May counties.
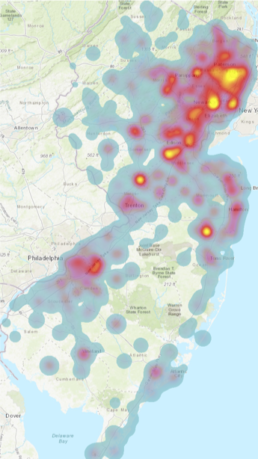
As you can see geography-wise the funds have “landed” quite unevenly. From the picture below you can see several concentration clusters. While concentration of small businesses receiving loans in the north-eastern part of the state, in close proximity to New York City is not surprising there are certain ‘outliers’ that prompt questions.
To contextualize the data we connected PPP data to population figures on a zip code level for a few interesting clusters. See table below.

Let’s take a closer look…
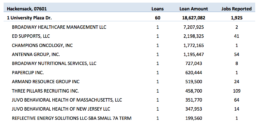
Well, in Hackensack there is one inconspicuous five story office building with the concentration of 60 businesses approved for $18M loans. According to the filings the businesses located at this address would be saving or hiring almost 2 thousand jobs. The table below lists the top loan recipients.
QUESTIONS
Meanwhile...

… the parking lot can only hold about 300 vehicles. Obviously parking lot includes space for the visitors to the medical offices located in this building.
The other oddity which draws our attention is that the number of jobs reported by the loan recipients often does not explain how these businesses get so much money. According to the rules established by the Congress the loan cannot exceed $46,154 per employee not including health and retirement benefits. We hope that these questions will have a legitimate explanation. Meanwhile we will be doing a deeper dive into the data to uncover other idiosyncrasies that could help to understand the cases and the extent of potential fraud.
Is the taxpayer’s money is deployed where they needed the most?
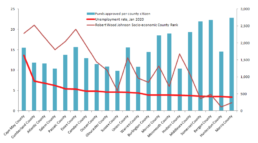
The following chart shows the value of PPP loans in each of NJ counties divided into the county population and contrast this with Robert Wood Johnson socio-economic county ranking (low rankings are “good”; high rankings are “bad”) and unemployment rate in each of the counties as measured in January 2020. The emerging picture is that people in poor counties get less help from PPP program than people in counties where socio-economic environment is better. So, better you are more you get. Just food for thoughts…
We also asked...
Is taxpayer's money is deployed where it's needed the most?
What can we learn...
Is there anything we can learn about PPP lenders?
Well, the banks, credit unions and other financial organization can benefit greatly from the program. On top a reasonable interest they can acquire a lot of new small business customers. We thought that PPP gives the lenders a unique opportunity to offer their services to the customers that they otherwise much less likely approach as part of their regular marketing campaigns, i.e. businesses residing outside of their regular servicing areas. To understand better the new customer acquisition opportunity we ask SRS to connect PPP data set with another open dataset containing all FDIC registered lending institutions and their branches. This connection allows us to find out the number of PPP loan recipients residing in the states where lending banks do not have physical presence. We learned that the following four banks reached out to every state in the nation and acquired a lot of new customers outside of their regular servicing areas.
Note: PPP loan numbers do not include loans returned by businesses back into the program.
We used SRS connected data for this case study. It made many data “massaging” and calculation tasks fast and easy because SRS has already addressed many integration and data quality issues freeing users from mundane and time-consuming tasks.