
AI ready state
Spatial-Level data fully optimized for emerging AI Technologies – LLM (Large Language Models), Generative AI
For data to be considered in an AI ready state, the following ‘data’ conditions need to be in place.
Data Connectivity
All the individual data points need to be directly connected or indirectly connected to one another.
Data Precision
Data must be high quality. 'Dirty' data will invalidate ML/AI results every time.
Standardized Taxonomies
Connecting and standardizing dozens of data sets into a single knowledge graph, SRS provides a turn-key data solution
Hierarchical Relationships
Hierarchies play a critical factor in mapping data relationships, data networks, and building decision trees. ML/AI 'shines' when hierarchical relationships are fully supported.
Data Aggregation
Knowledge Graphs support simple methods for data aggregation and data drill down.
Point in Time
All nodes or entities in a Knowledge Graph can support attribute values over time.
Data Visualization
Data connectivity greatly expands and enhances data visualization and data reporting.
Data Integration
The ability to provide multiple ways to easily connect to other third party and open data sources.
Single Data Catalog
Simple way to drive data discovery and data access.
4
Data Governance and Spatial Risk
Critical factors in play
from a data governance perspective.
1. Issuers
2. Security Level
ISIN, CUSIP, Loan Identifiers
3. Listing Level
Exchange Code/Ticker Symbol, SEDOL
4. Point in Time
Time Series - Climate, Environmental, Emissions, Electricity Generation.
SRS Knowledge Graph now adds a spatial layer to the existing data ecosystem
Seamlessly connecting asset locations to public, private and governmental entities, their financial identifiers (i.e., ISIN, Ticker, etc..) and relevant climate, environmental and socioeconomic factors.
5. Point in Space
Location-specific factors impacting investment and operational outcomes.
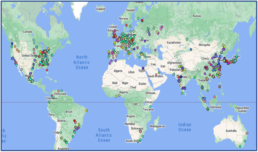
3.5 Million+ Asset Locations
Multiple Name Support for a Given Asset Location
Fully Support Entity Name Resolution and Disambiguation
| wdt_ID | Asset ID | Asset Name |
|---|---|---|
| 1 | 2700586 | EXXONMOBIL REFINERY COMPLEX |
| 2 | 2700586 | Chalmette Refinery |
| 3 | 2700586 | CHALMETTE REFINERY LLC |
| 4 | 2700586 | MOBIL OIL CORP. - CHALMETTE REFINERY |
| 5 | 2700586 | EXXON - CHALMETTE REFINERY |
| 6 | 2700586 | CHALMETTE REFINING LLC - CHALMETTE REFINERY |
| wdt_ID | Code | Taxonomy Description | Attribute Types | Attribute Count |
|---|---|---|---|---|
| 1 | X001 | Crime | 11 | 485.515 |
| 2 | X002 | Economic | 14.585 | 154.107.889 |
| 3 | X003 | Environmental | 206 | 54.571.425 |
| 4 | X004 | Health/Medical | 763 | 33.134.798 |
| 5 | X005 | Energy | 36 | 810.720 |
| 6 | X006 | Housing | 1.633 | 612.809.433 |
| 7 | X007 | Population/Age/Sex | 648 | 194.019.046 |
| 8 | X008 | Income | 368 | 139.160.672 |
| 9 | X009 | Education | 2.094 | 343.969.116 |
| 10 | X010 | Poverty | 1.702 | 294.072.552 |
Single Attribute File
Unifying hundreds of spatial level data sets under a single set of standards
23,000+ Unique Attribute Types
2 Billion+ Attribute Values
| wdt_ID | Sample Attribute Types | Value |
|---|---|---|
| 1 | Energy: Power Plant/Facility (MW: Megawatt Capacity) | 2.786 |
| 2 | TRI (Toxic Release Inventory) Tot pounds per year transferred off-site. | 157.328 |
| 3 | Total Facility Emissions in metric tons CO2e (Annual) | 2.726.517 |
| 4 | Number of Beds | 676 |
| 5 | Age - 60 Years and Over: Percent below poverty level | 28 |
| 6 | Bedrooms - Total Housing Units | 51.213 |
| 7 | Coastal Flooding - Exposure - Building Value | 0 |
Extensive Classification Taxonomy
1,700+ Categories
| wdt_ID | Sector | Sub-Sector |
|---|---|---|
| 1 | Chemical manufacturing | Industrial gas manufacturing plant |
| 2 | Petroleum and coal products manufacturing | Petroleum refineries |
| 3 | Machinery manufacturing | Industrial machinery mfg plant |
| 4 | Mining | Coal Mine |
| 5 | Food Manufacturing | Dairy product manufacturing plant |
| 6 | Hospitals/Clinics | Children's Hospital |
| wdt_ID | Code | Taxonomy Description | Asset Location Count |
|---|---|---|---|
| 1 | S030 | Beverage and tobacco product manufacturing | 1.554 |
| 2 | S031 | Textile mills | 2.829 |
| 3 | S032 | Textile product mills | 1.316 |
| 4 | S033 | Apparel manufacturing | 1.356 |
| 5 | S034 | Leather and allied product manufacturing | 768 |
| 6 | S035 | Paper manufacturing | 4.789 |
| 7 | S036 | Printing and related support activities | 12.301 |
| 8 | S037 | Wood product manufacturing | 13.494 |
| 9 | S038 | Petroleum and coal products manufacturing | 9.372 |
| 10 | S039 | Chemical manufacturing | 22.777 |
Selected Categories
Map relevant facility-level or geographic-level data to an asset location
Enables thousands of data points (Points in Space) to be quickly aggregated and exposed at an issuer level for risk analytics, reporting, and data science purposes.
This example looks at the two asset locations and their associated identifiers. Behind these identifiers are thousands of factors and attributes associated with the facility and the local area.
| wdt_ID | Asset ID | Asset Name Parent | Ult Parent |
|---|---|---|---|
| 1 | 3521905 | Huntersville LNG Facility Piedmont Natural Gas Co. | Duke Energy (NYSE: DUK) |
| 2 | Source ID | Source Description | Source Value |
| 3 | 17 | US Census County FIPS Code | 37119 |
| 4 | 18 | US Congressional District Code (CD) | NC: Congressional District 12 |
| 5 | 20 | US Census Core Based Statistical Area (CBSA) | 16740 |
| 6 | 21 | US Census Combined Statistical Area (CSA) | 172 |
| 7 | 23 | US Census Metropolitan/Micropolitan Indicator (METMIC) | 1 |
| 8 | 26 | US EPA Reg ID | 110038855511 |
| 9 | 32 | US Census Region Code | 3 |
| 10 | 33 | US Census Division Code | 5 |
| wdt_ID | Asset ID | Asset Name Parent | Ult Parent |
|---|---|---|---|
| 1 | 15584 | Bartow Regional Med Ctr BayCare Health System | BayCare Health System |
| 2 | Source ID | Source Description | Source Value |
| 3 | 1 | NGA GEOnet Names | 4146729 |
| 4 | 13 | Wikipedia | 42042432 |
| 5 | 14 | Wikidata | Q16164841 |
| 6 | 17 | US Census County FIPS Code | 12105 |
| 7 | 18 | US Congressional District Code (CD) | FL: Congressional District 17 |
| 8 | 20 | US Census Core Based Statistical Area (CBSA) | 29460 |
| 9 | 21 | US Census Combined Statistical Area (CSA) | 422 |
| 10 | 23 | US Census Metropolitan/Micropolitan Indicator (METMIC) | 1 |
20.6 million+ Cross-Reference Relationships
From dozens of sources.
| wdt_ID | Source ID | Source Description | Source Count |
|---|---|---|---|
| 1 | 67 | ISIN Number | 38.810 |
| 2 | 63 | Issuer CUSIP Number | 61.514 |
| 3 | 14 | Wikidata | 278.034 |
| 4 | 13 | Wikipedia | 248.728 |
| 5 | 16 | US State School District ID Number | 34.774 |
| 6 | 36 | US NCES Public School ID Number | 108.719 |
| 7 | 17 | US Census County FIPS Code | 1.824.229 |
| 8 | 18 | US Congressional District Code (CD) | 1.558.826 |
| 9 | 20 | US Census Core Based Statistical Area (CBSA) | 1.538.541 |
| 10 | 24 | US EIA Utility ID | 6.535 |
| wdt_ID | Geo-Spatial Lavel | ID |
|---|---|---|
| 1 | County | 1 |
| 2 | Census Region | 2 |
| 3 | Census Division | 3 |
| 4 | State/Province | 4 |
| 5 | Metropolitan Area | 5 |
| 6 | Voting District | 6 |
| 7 | County/Regional | 7 |
| 8 | District/Regional | 8 |
| 9 | City | 9 |
| 10 | City Sub-Section | 10 |
The SRS geo-hierarchy allows new data sets to be quickly onboarded in a matter of hours and not weeks...
…and have these factors quickly exposed via SRS’ single fact table. Most available data sets are published at a geographic or geopolitical level.
Simple Data Aggregation Path
Data can be quickly aggregated at any one of the following geographic levels:
| wdt_ID | Geo Level | State | County | City | Postal Code | Census Tract |
|---|---|---|---|---|---|---|
| 1 | Census Tract | Texas | Bexar County | San Antonio | 2.147.483.647 | |
| 2 | Census Tract | Texas | Bexar County | San Antonio | 2.147.483.647 | |
| 3 | Census Tract | Texas | Bexar County | San Antonio | 2.147.483.647 | |
| 4 | Postal Code | Texas | Bexar County | Adkins | 78101 | |
| 5 | Postal Code | Texas | Bexar County | Atascosa | 78002 | |
| 6 | Postal Code | Texas | Bexar County | Converse | 78109 | |
| 7 | City | Texas | Bexar County | Converse | ||
| 8 | City | Texas | Bexar County | Live Oak | ||
| 9 | City | Texas | Bexar County | San Antonio | ||
| 10 | County | Texas | Bee County |
OUR ANALYTIC EDGE
Asset Locations: By facility, company, industry, sector, portfolio
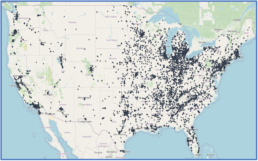
US Transportation Equipment Sector
OUR ANALYTIC EDGE
Demographic: hundreds of sources, multiple geographies
Organizing and Standardizing thousands of factors and 2 Billion+ attribute values into a single fact table.
| wdt_ID | Attribute Type ID | Attribute Type Description |
|---|---|---|
| 1 | 10307 | Percentile for Air toxics cancer risk |
| 2 | 10306 | Percentile for Diesel particulate matter level in air |
| 3 | 10304 | Percentile for % pre-1960 housing (lead paint indicator) |
| 4 | 10300 | Percentile for % less than high school |
| 5 | 10301 | Percentile for % of households (interpreted as individuals) in linguistic isolation |
| 6 | 10299 | Percentile for % low-income |
| 7 | 10298 | Percentile for % people of color |
| 8 | 10303 | Percentile for % over age 64 |
| 9 | 10314 | Percentile for Ozone level in air |
| 10 | 10315 | Percentile for PM2.5 level in air |