Since the Climate Impact Score is made up
Using the SRS Spatial Library
By Raymond O. Clarke | Chief Product Officer
When examining risk to assets investors should familiarize themselves with the location of the asset and the risk posed by local climate conditions and how it will impact value and stability. In addition, nearby environmental risks factors must be considered in the decision-making process as unfolding climate events will undoubtedly impact upon environmental issues and could pose a hazard long after the climate event has run its course.
Working with the SRS Climate Risk and the SRS Environmental Risk database there is strong indication that if climate and environmental factors are not properly accounted for in investment decisions undue stress will eventually impact an asset’s value.
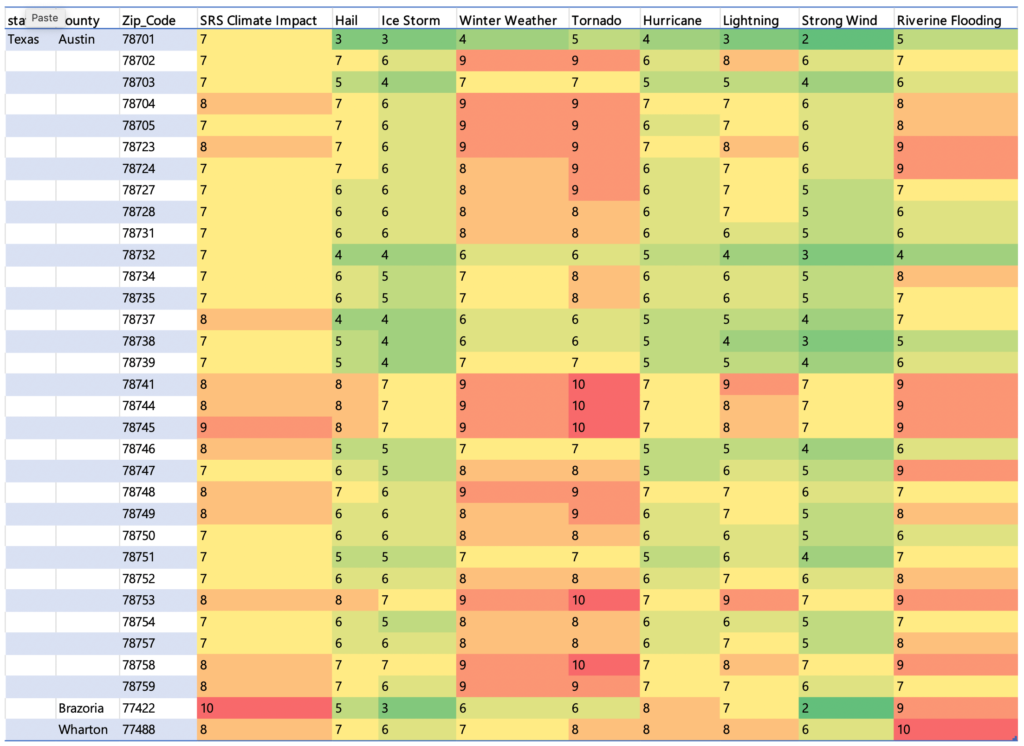
The Climate Impact Score[1] represents the overall risk from all possible types of natural disasters. This metric is meant to be an effective means to measure the effect of disruptive climate on geographic locations and on the assets located within its boundaries. The SRS Climate Impact Score is part of the SRS climate database and is tracked at numerous geographic levels to include but not limited to tract, zip code, county, city, and state
[1] SRS using a numeric scoring system of 1- 10, with 10 being the most severe. https://spatialrisksystems.com/srs-scores/
As in the case of the Texas Winter Storm of 2021, the initial event was brought on by climate, but the shock lingered long after due to the presence of environmental risk factors.
Utilities in charge of power generation and clean water were knocked offline during freezing conditions. The local economy suffered as businesses shuttered due to the aftermath and ongoing fallout from lack of working utilities.
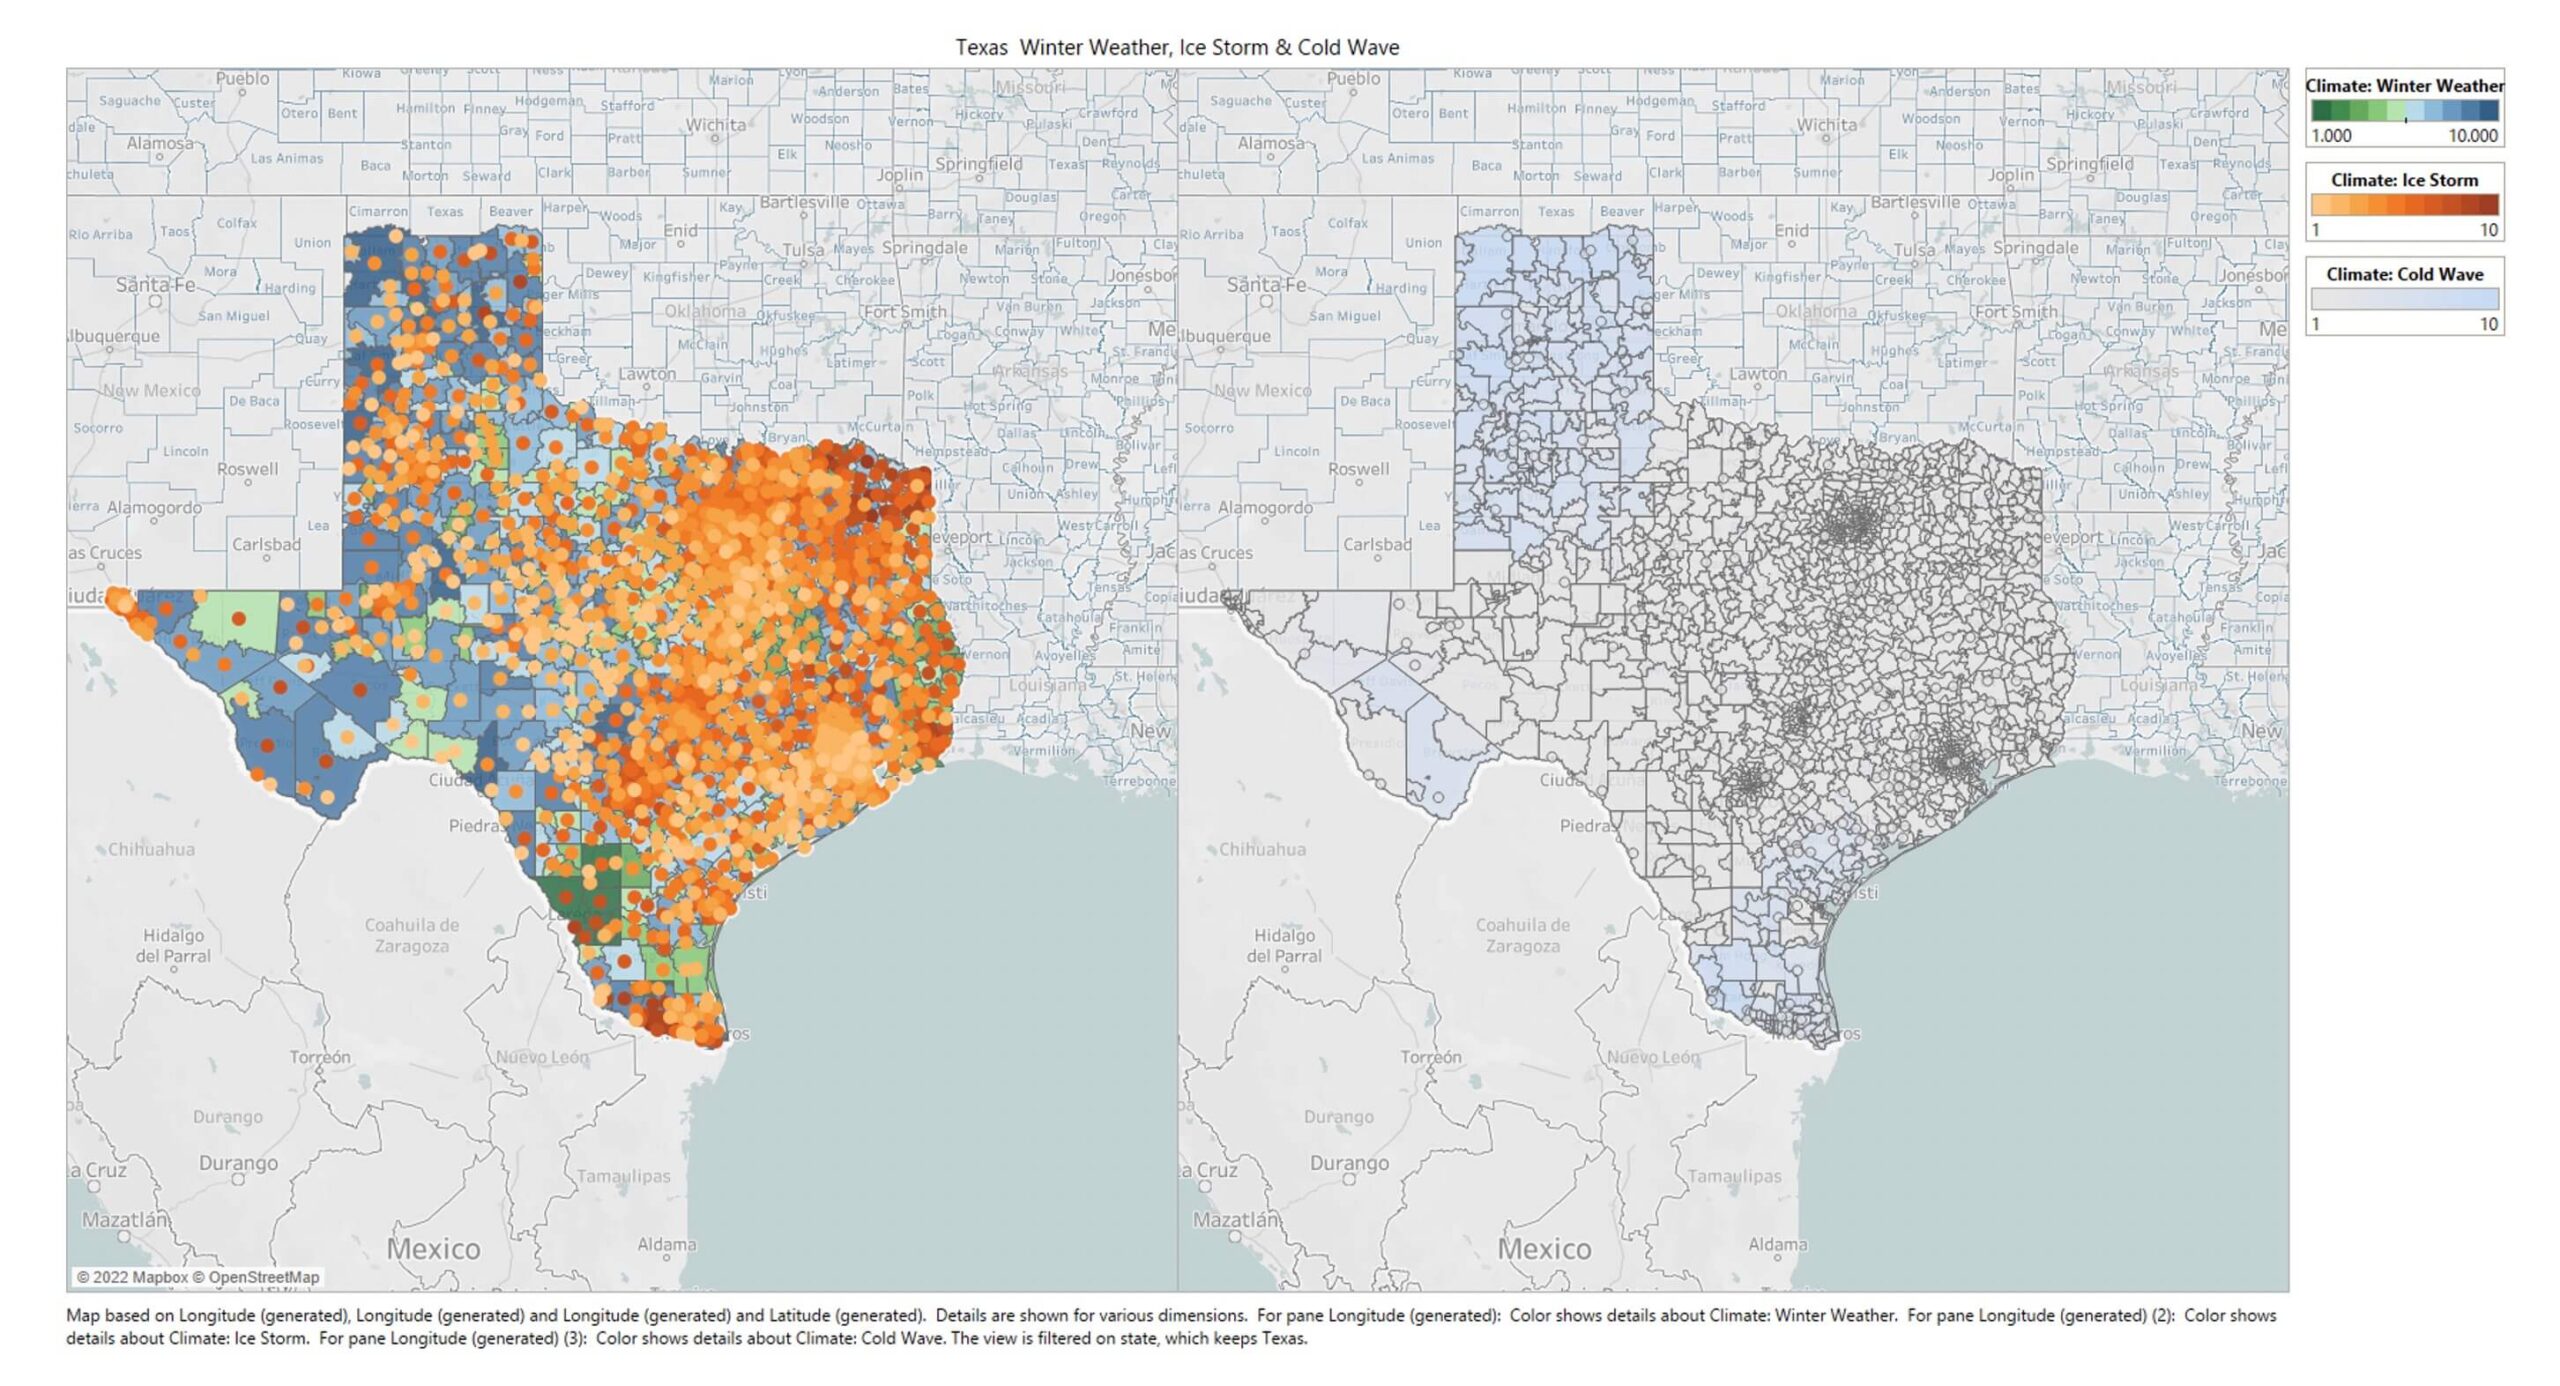
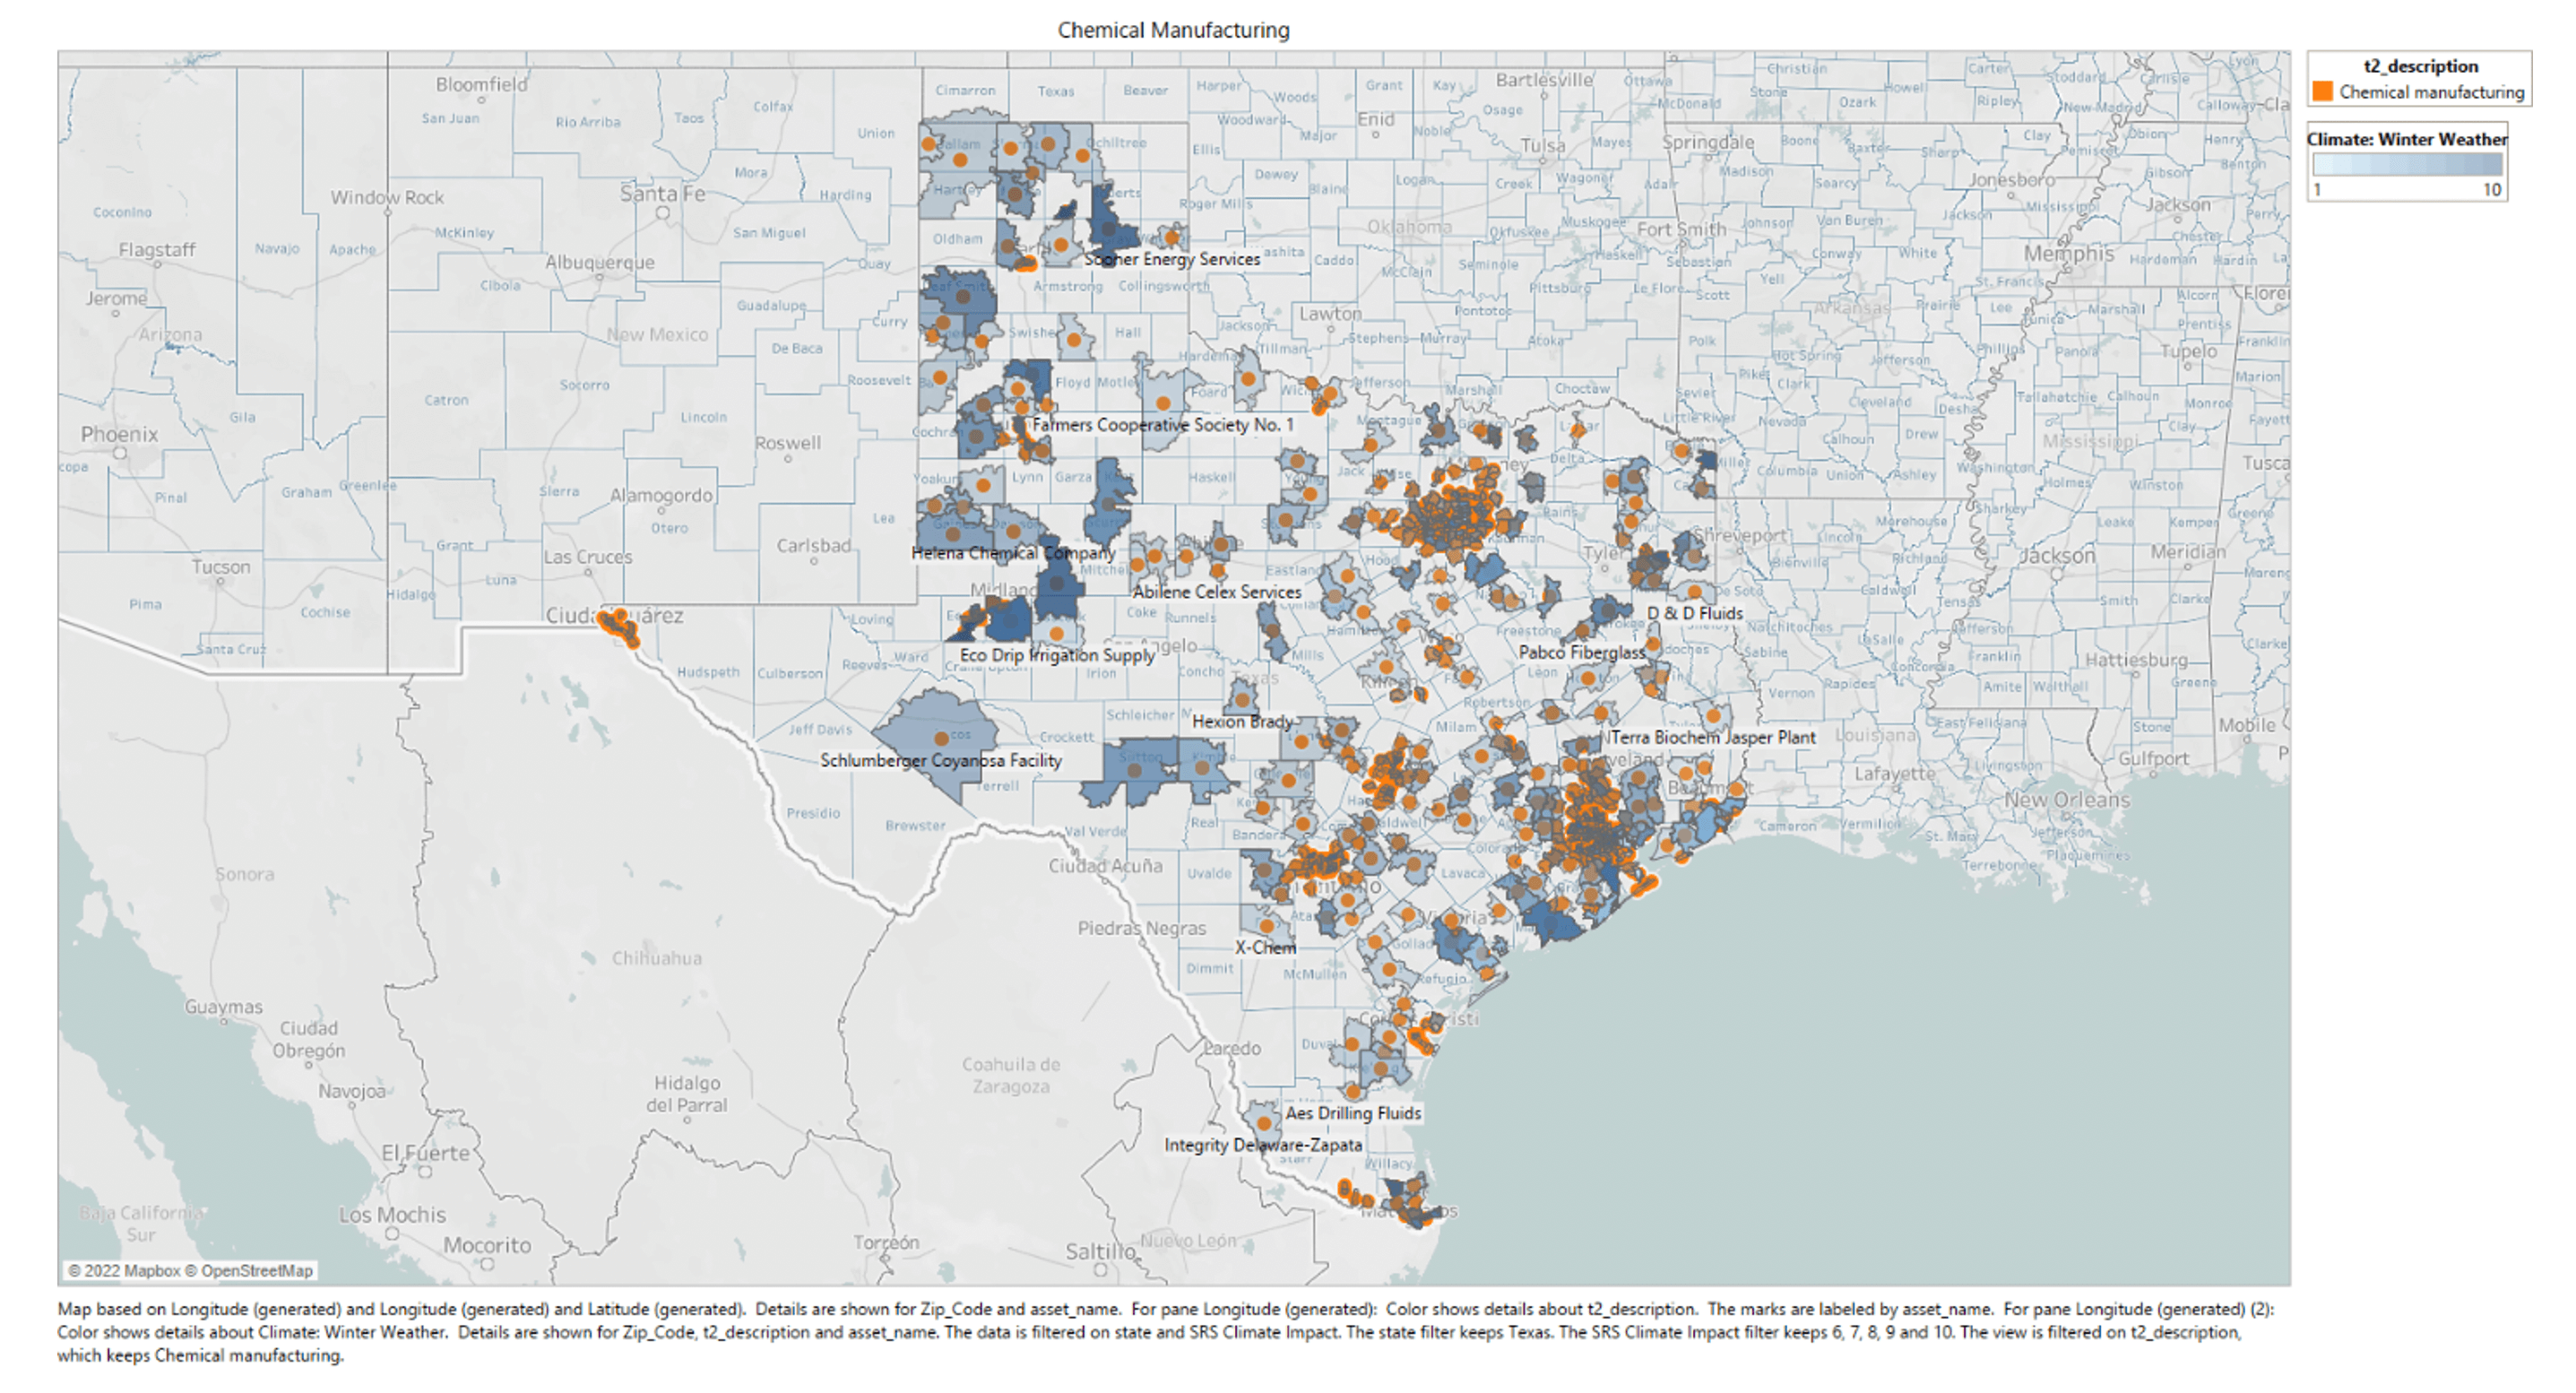
Data from the SRS Climate Risk database shows where the state of Texas can expect disruptive winter weather.
Unless the infrastructure that generate and deliver power is hardened against this climate risk assets will continue to incur losses when these events occur.
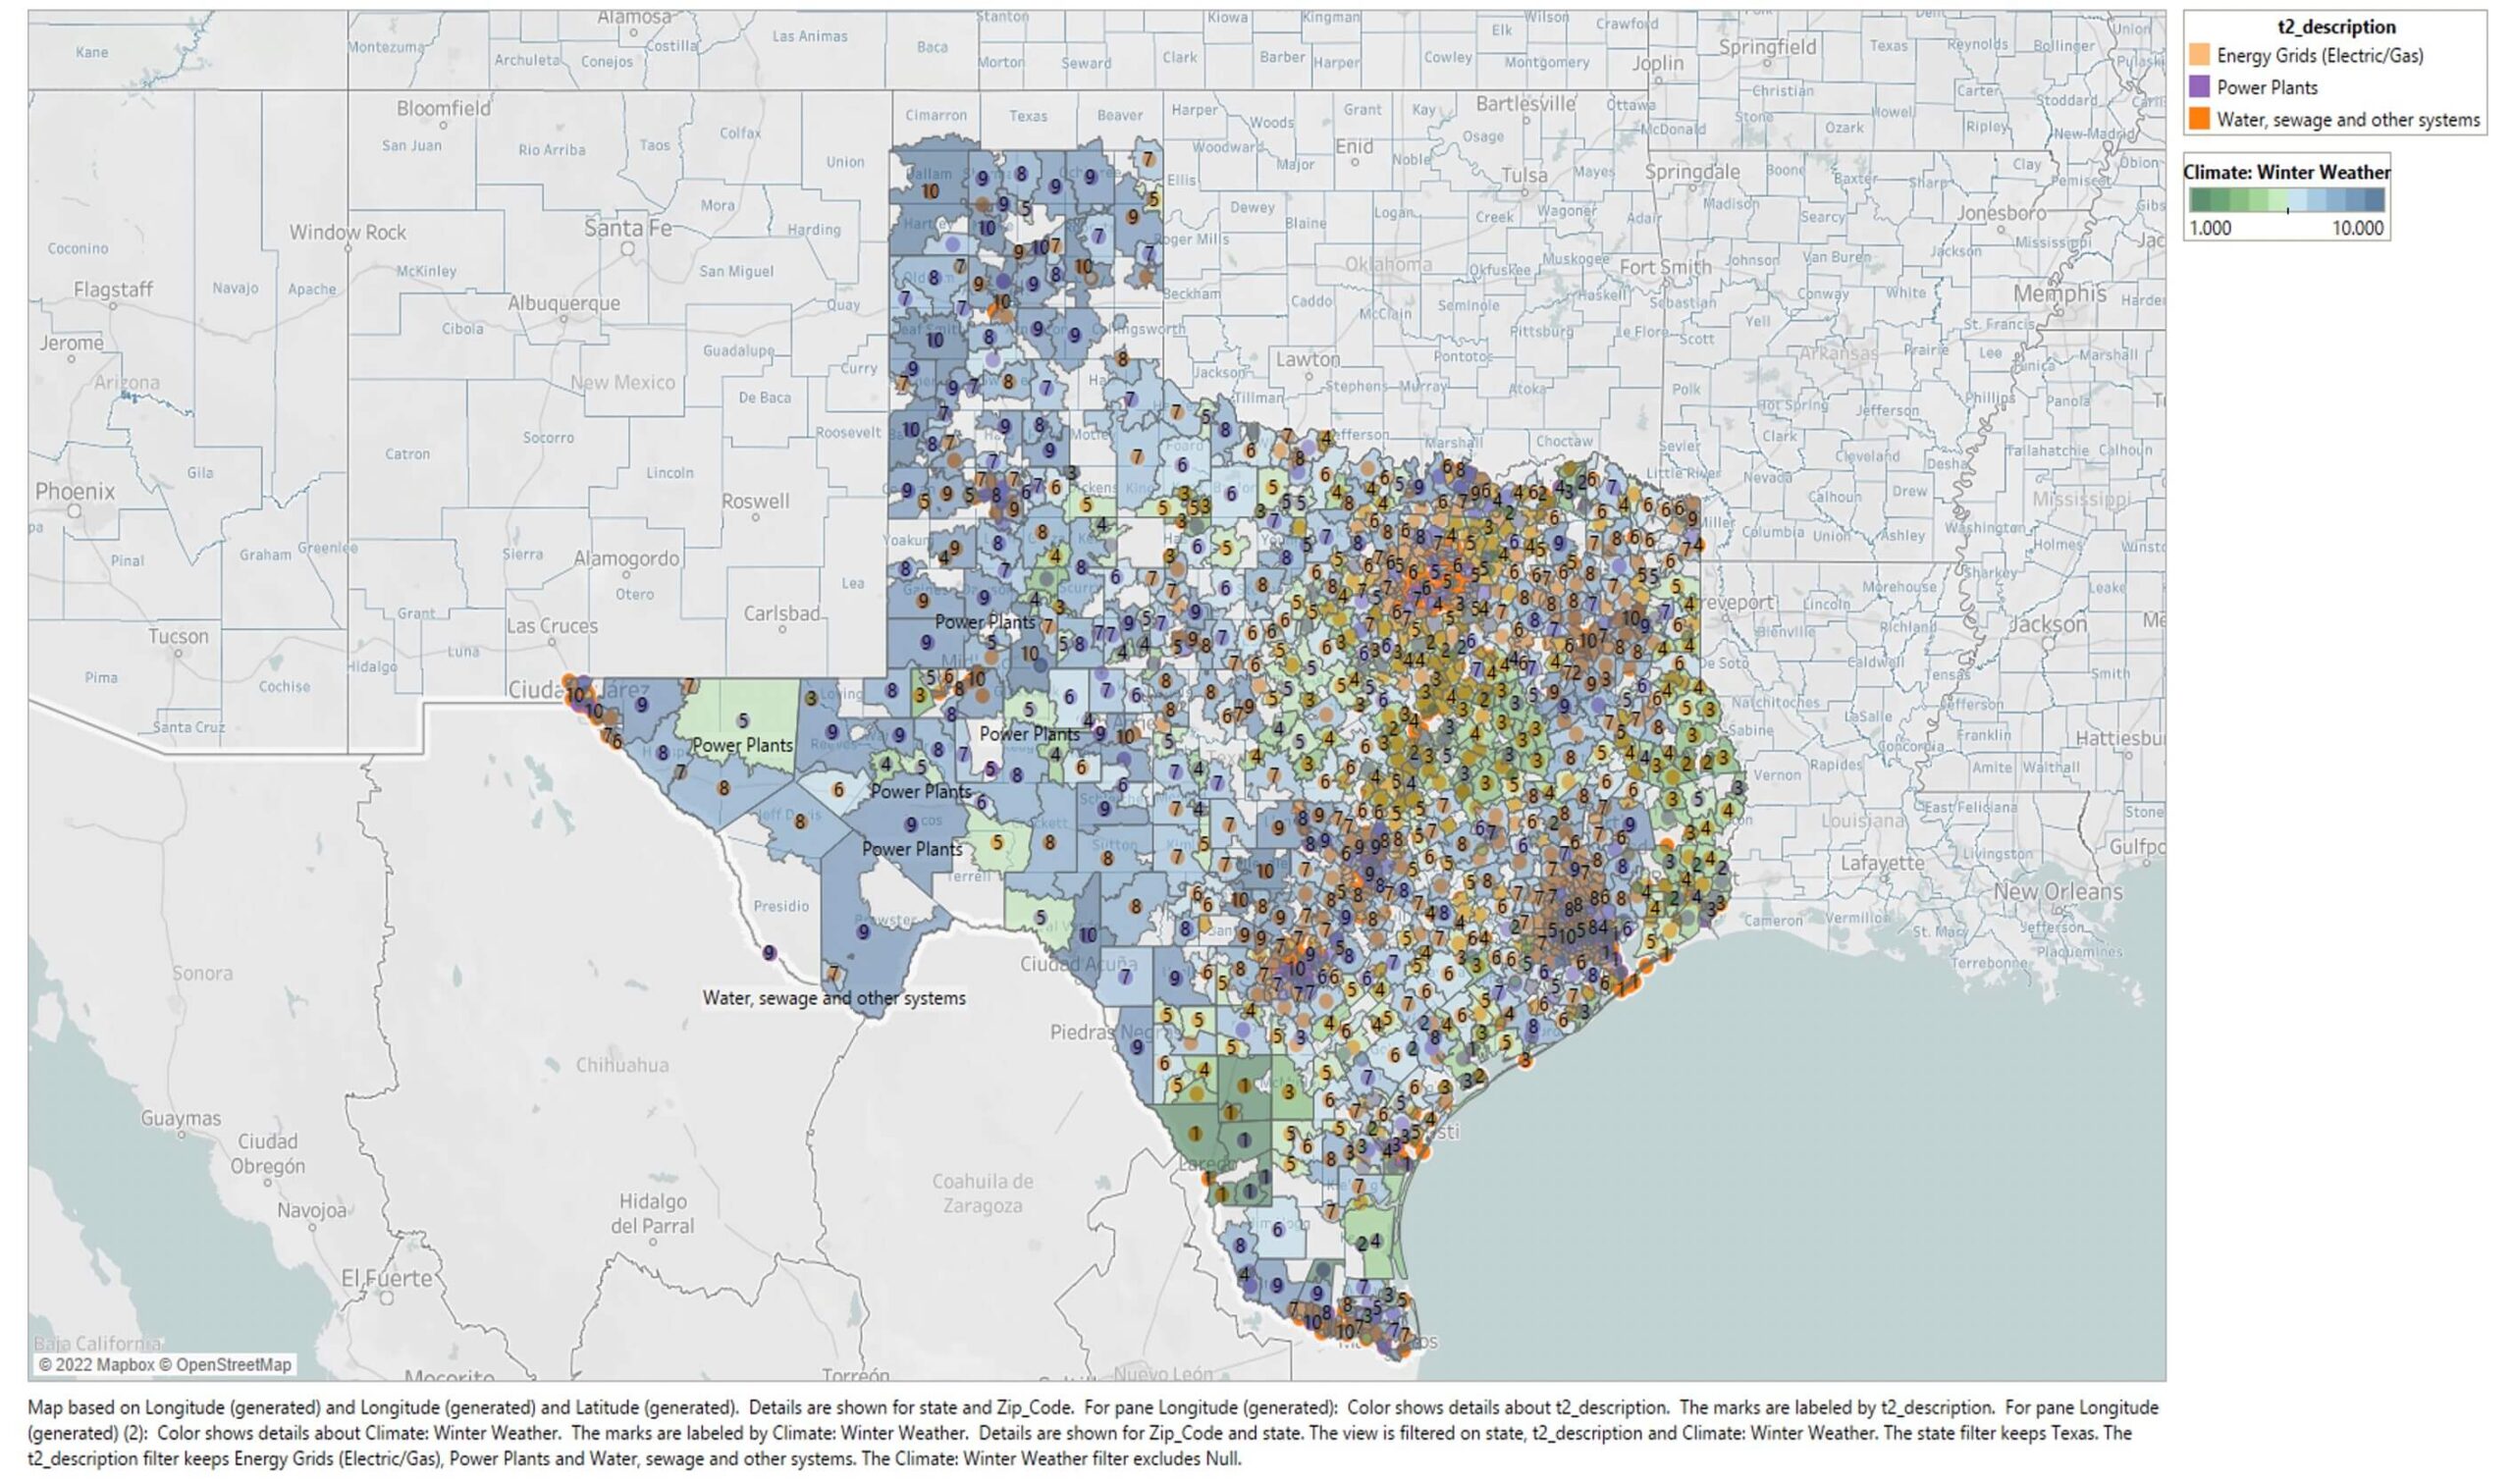
When the energy grid and water treatment facilities failed…
…during the Texas high-risk winter weather it created pressure on assets in the storm’s path and well beyond. By not adequately preparing for the risk posed by local climate conditions these utilities had the unintended consequence of disrupting the entire Texas economy and the supply chain of companies that depend on them.
Texas is a major hub of chemical production in the United States with 75 percent of US chemical production. Chemicals shipments from Texas stopped in the days following Winter storm Uri effectively hindering the supply chain of the companies that relied on those supplies.
When the power grid went down those plants stopped producing the chemicals needed by other manufacturers across the United States and beyond.
Chemical producers in Texas saw their inflation-adjusted value…
…decrease by over 20 percent in the month following winter storm Uri[1]according to data from the Texas Comptroller’s Office. The takeaway is that it has become necessary to not just know your own risk but to know the risk of your supply chain as well.
[1] https://comptroller.texas.gov/economy/fiscal-notes/2021/oct/winter-storm-impact.php
Spatial Risk
Climate Impact
Environmental
Community Resilience
Social Vulnerability
In our study of communities across the United States we find that the initial punch is often climate related, but other factors dictate the outcome of that initial punch.
The vulnerability and resilience of the communities at or near the location of the assets will have a profound impact on the outcome of any extraordinary event. If a community is resilient, it will be better able to deal with the negative effects of disaster but if a community has preexisting vulnerabilities the event’s negative effects will be magnified and long lasting.
Investors should be mindful of the spatial risk (climate, environmental and demographics) they take on when investing in an asset. By consulting the SRS climate, environmental and demographic data we identify high-risks locations for assets that have the potential to be troubling for investors.
We also analyze the demographics of the communities by way of resiliency end vulnerability to gauge the likely outcome of how the environmental and climate events will unfold and what recovery will look like.
In the SRS data of the Harrisburg Pa metropolitan area, the climate impact score coupled with the environmental risk score should be concerning for investors with assets in the area.
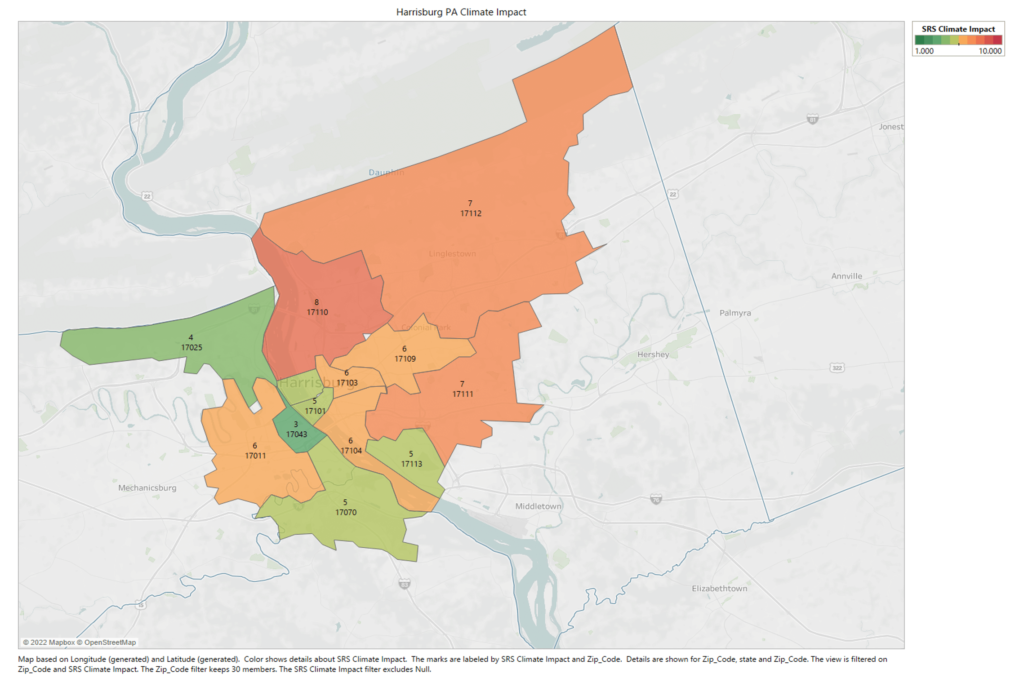
. In the case of Harrisburg winter weather, strong wind, tornado lightening and flooding either should be mediated through superior insurance or hardening of the asset’s infrastructure and the utilities that serve them.
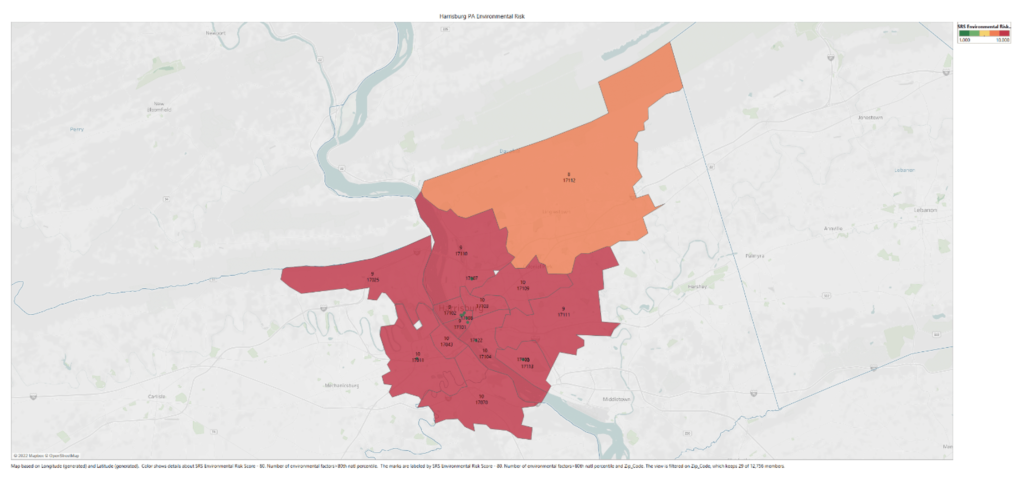
The environmental hazards in the area are on the most severe end of the spectrum and could react negatively to a climate event if steps are not taken to minimize the worst outcome.
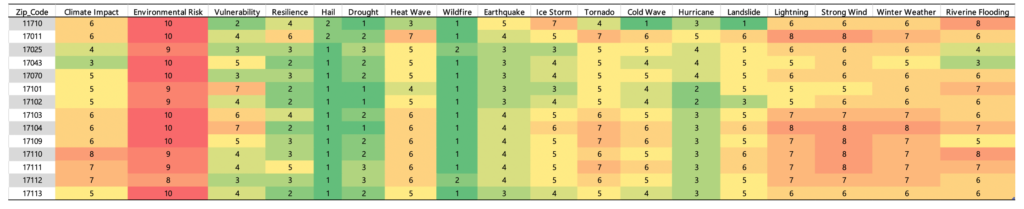
The vulnerability and resilience…
…around the locations offers some hope and seems to indicate that Harrisburg will be able withstand the impact of a stressful event, but the challenges are high.
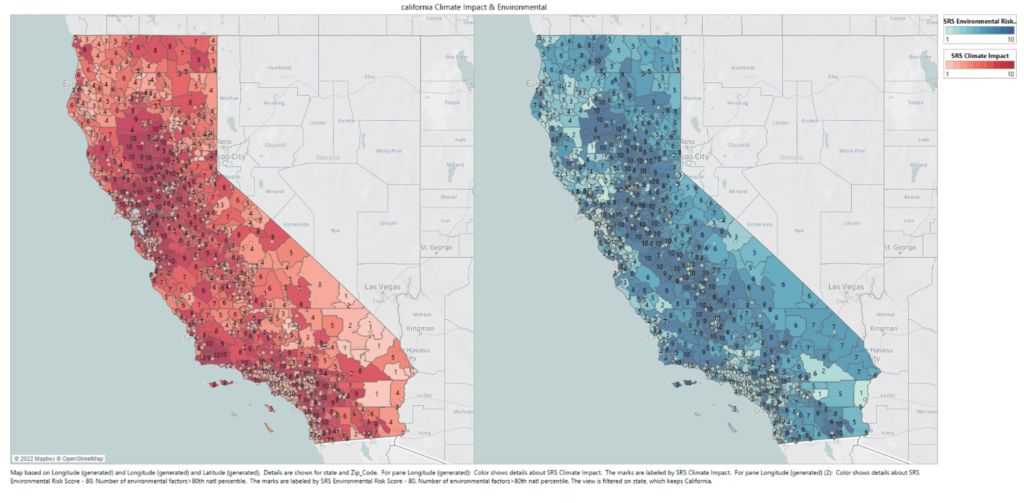
California has a host of climate and environmental issues to confront.
As we can see from the SRS Climate and Environmental overview a large swath of the state carries both the most severe environmental and climate score.
The assets in that in those areas appear in Commercial Mortgage-Backed Securities (CMBS), Residential Mortgage-Backed Securities (RMBS) and Collateralized Loan Obligations (CLOs).
The SRS climate impact score and the underlying climate conditions to make sure they are protected against climate and environmental disaster when they occur.
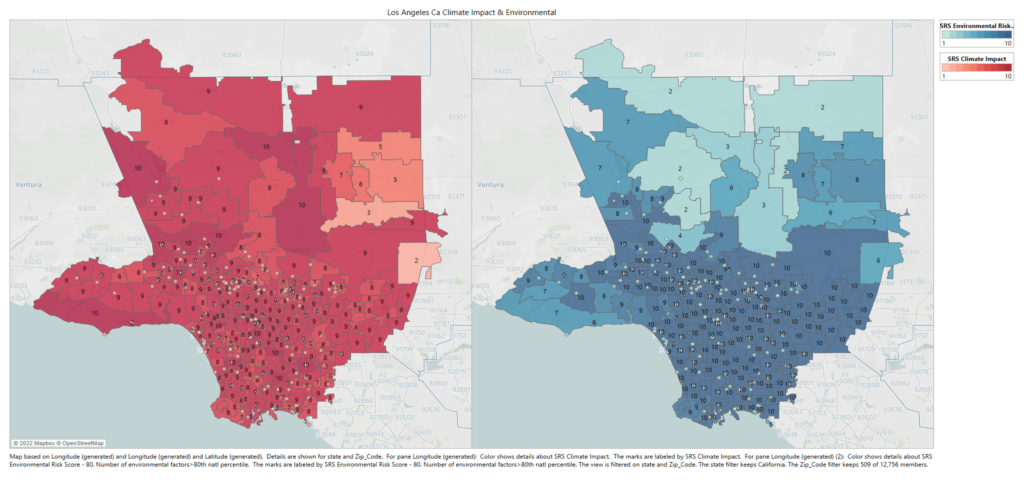
California is not unique as we see this same pattern…
…in many locations across the United States. Where climate related risk is high, further compounded by environmental risk factors puts the asset in that area at greater physical risk and financial loss.
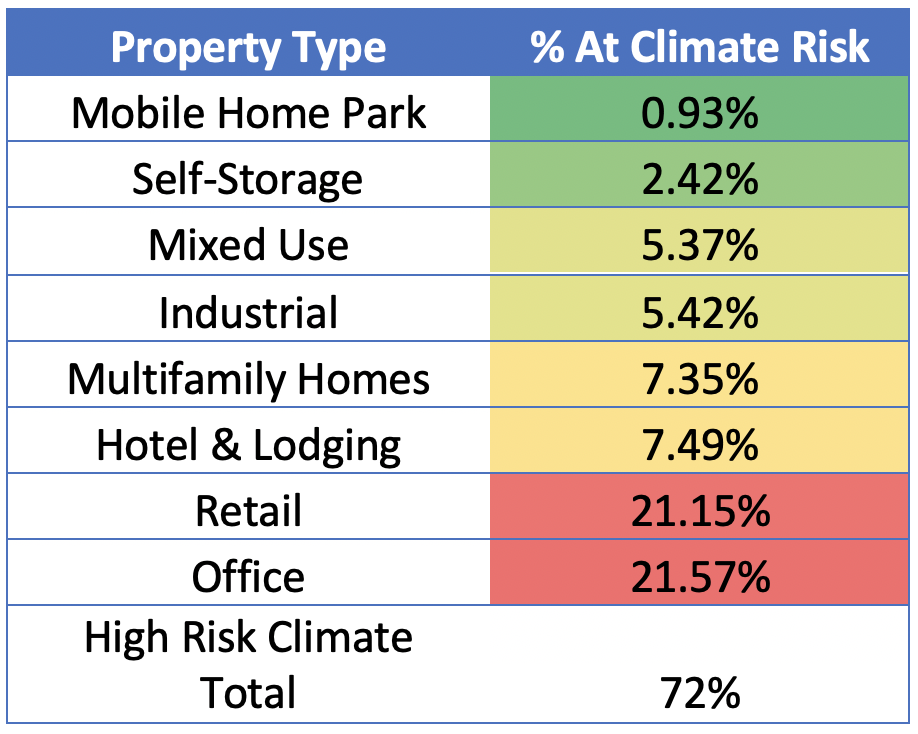
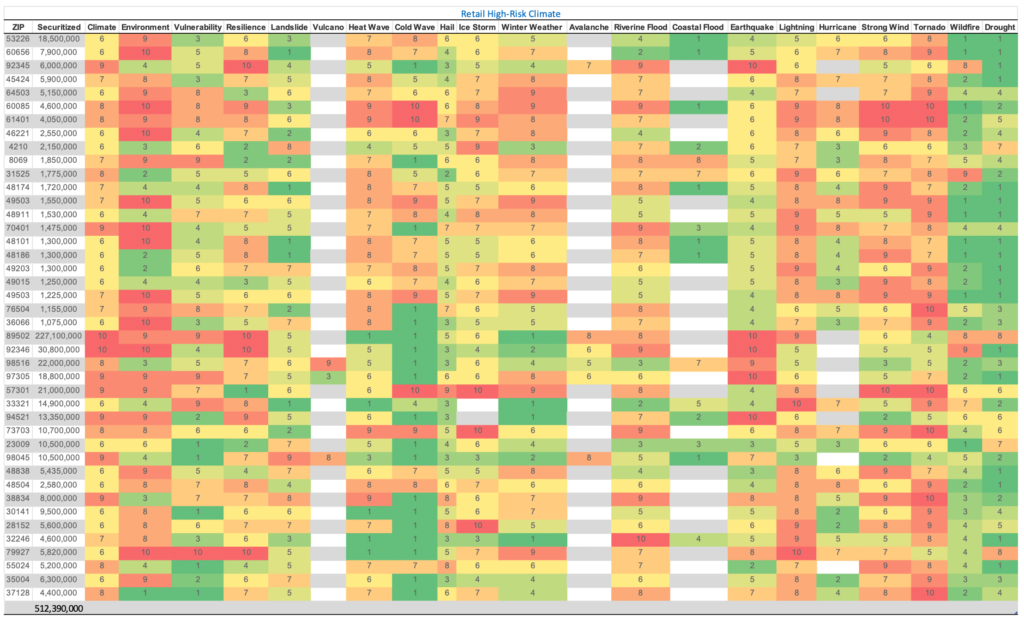
In examining a CMBS portfolio valued at 2.5 billion USD, 72% of the assets appear in high-risk climate zones (those areas scoring 6 and higher in the SRS Climate Impact database). The sectors (Retail and Office space) that dominate the risky climate bucket are already in the headlines for their precarious financial position due to social and work changes.
SPATIAL RISK SYSTEMS
Founded by data science leaders from the financial sector, SRS is an innovative data and analytics company that has engineered the first global ‘spatial knowledge graph’ to measure and quantify corporate and government location-based risks. We’ve unified hundreds of open data and proprietary sets into a single fact table. An optimized data state for Machine Learning and AI. From this highly connected data graph, SRS has engineered a Spatial Risk Factor Library with over 100 factors organized into four major components that can easily be embedded with other financial and non-financial data sources.
- Climate Change
- Carbon Emissions
- Environment Impact
- Socio-Economic