Spatial Risk Systems introduces the SRS Spatial Risk Scores, designed to measure risk at the location level. The SRS Risk Scores are calculated at the census tract, county, and postal code levels, or on a user-defined geographic area.
Spatial Risk Scores measure the exposure to location-specific factors that have a long-term effect on asset value, environmental impact, operational effectiveness, and social sustainability.
Designed to compare risk across different locations and expose the driving factors of risk in each location.
The SRS Spatial Scores are relative measures.
The SRS Risk Score further predicts the toll the event will have on a location by focusing on the extreme yet predictable effects of climate disasters. Will the population and the assets recover after the initial event, or will demographic and socioeconomic factors force a permanent change? We are assuming an asset that takes 10 or more years to recover is permanently altered. The scores are also a leading indicator of what might be expected from an environmental disaster
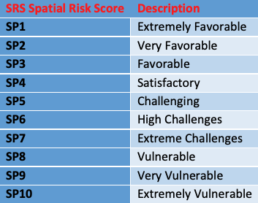
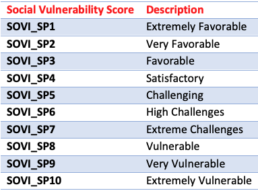
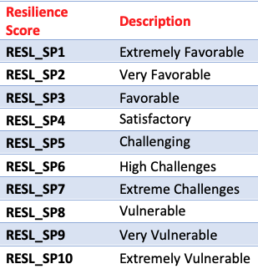
Using a methodology similar to the one described in the National Risk Index Primer, SRS quantifies risk to determine likely outcomes when a catastrophic event occurs, but with a few fundamental changes[1]. The Risk Scores are divided into ten risk bands where SP1 is the least risky and SP10 the most severe.
The Scores communicate the long-term risk posed to an asset if demographics, environmental, and social risk factors are not addressed.
The Scores communicate the long-term risk posed to an asset if demographics, environmental, and social risk factors are not addressed.
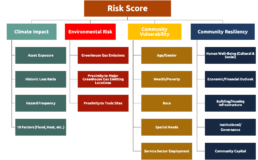
Underlying the primary SRS Risk Score are component scores that serve to magnify or mitigate the cost, toll, and duration of an event and affect the overall risk to a community or asset.
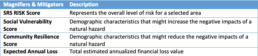
For example, if the SRS Social Vulnerability of an asset’s location is 6 (High Challenges), or higher, the area is more likely to have a difficult time recovering from climate or environmental-related events. Should the inverse be true, and the SRS Resilience score is on the satisfactory to favorable end of the scale, the asset will be more likely to overcome the adverse effects of climate and environmental-related disasters.
If an asset is in a high-risk location, mitigation plans should be put in place to limit the financial loss to that asset, should the event occur.
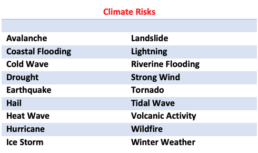
Environmental, climate/weather impact factors intensify the existing socio-economic conditions...
...leading to a higher risk for both population and assets.
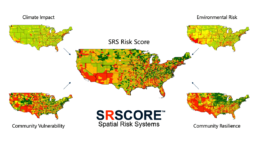
Each SRS Risk Score carries with it the interaction of location, climate, environmental, demographics, vulnerability, and resilience to better understand the risk to assets and population
Local environmental conditions such as air quality, proximity to dangerous, unsafe, and toxic release sites are distributed unevenly across the States. Understanding the interplay of these factors brings us to the root of Spatial Risk.
Investors, risk managers, and municipalities need to understand where their assets and communities fall on this spectrum. Are they located in areas where magnifiers or mitigators of risk exist?
The SRS Risk Scores enable us to understand, in advance, the unique mix of risk magnifiers and mitigators, which can so profoundly affect an outcome when the area comes under pressure.
Our review of natural disasters and their outcome has shown that while the risk factors were often identified, they were not quantified to measure the overall spatial risk. The SRS Risk Scores are designed to start that conversation.
SRS Scores at the County, Zip and Tract Level
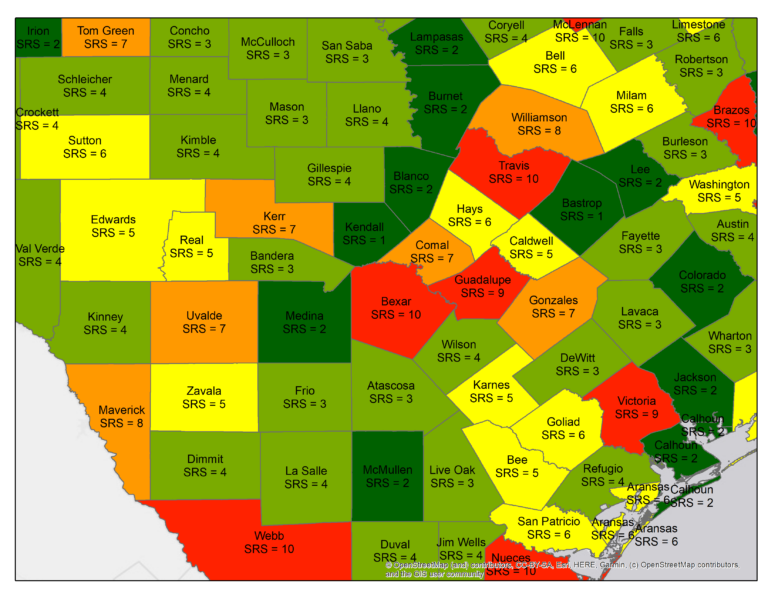
County Level
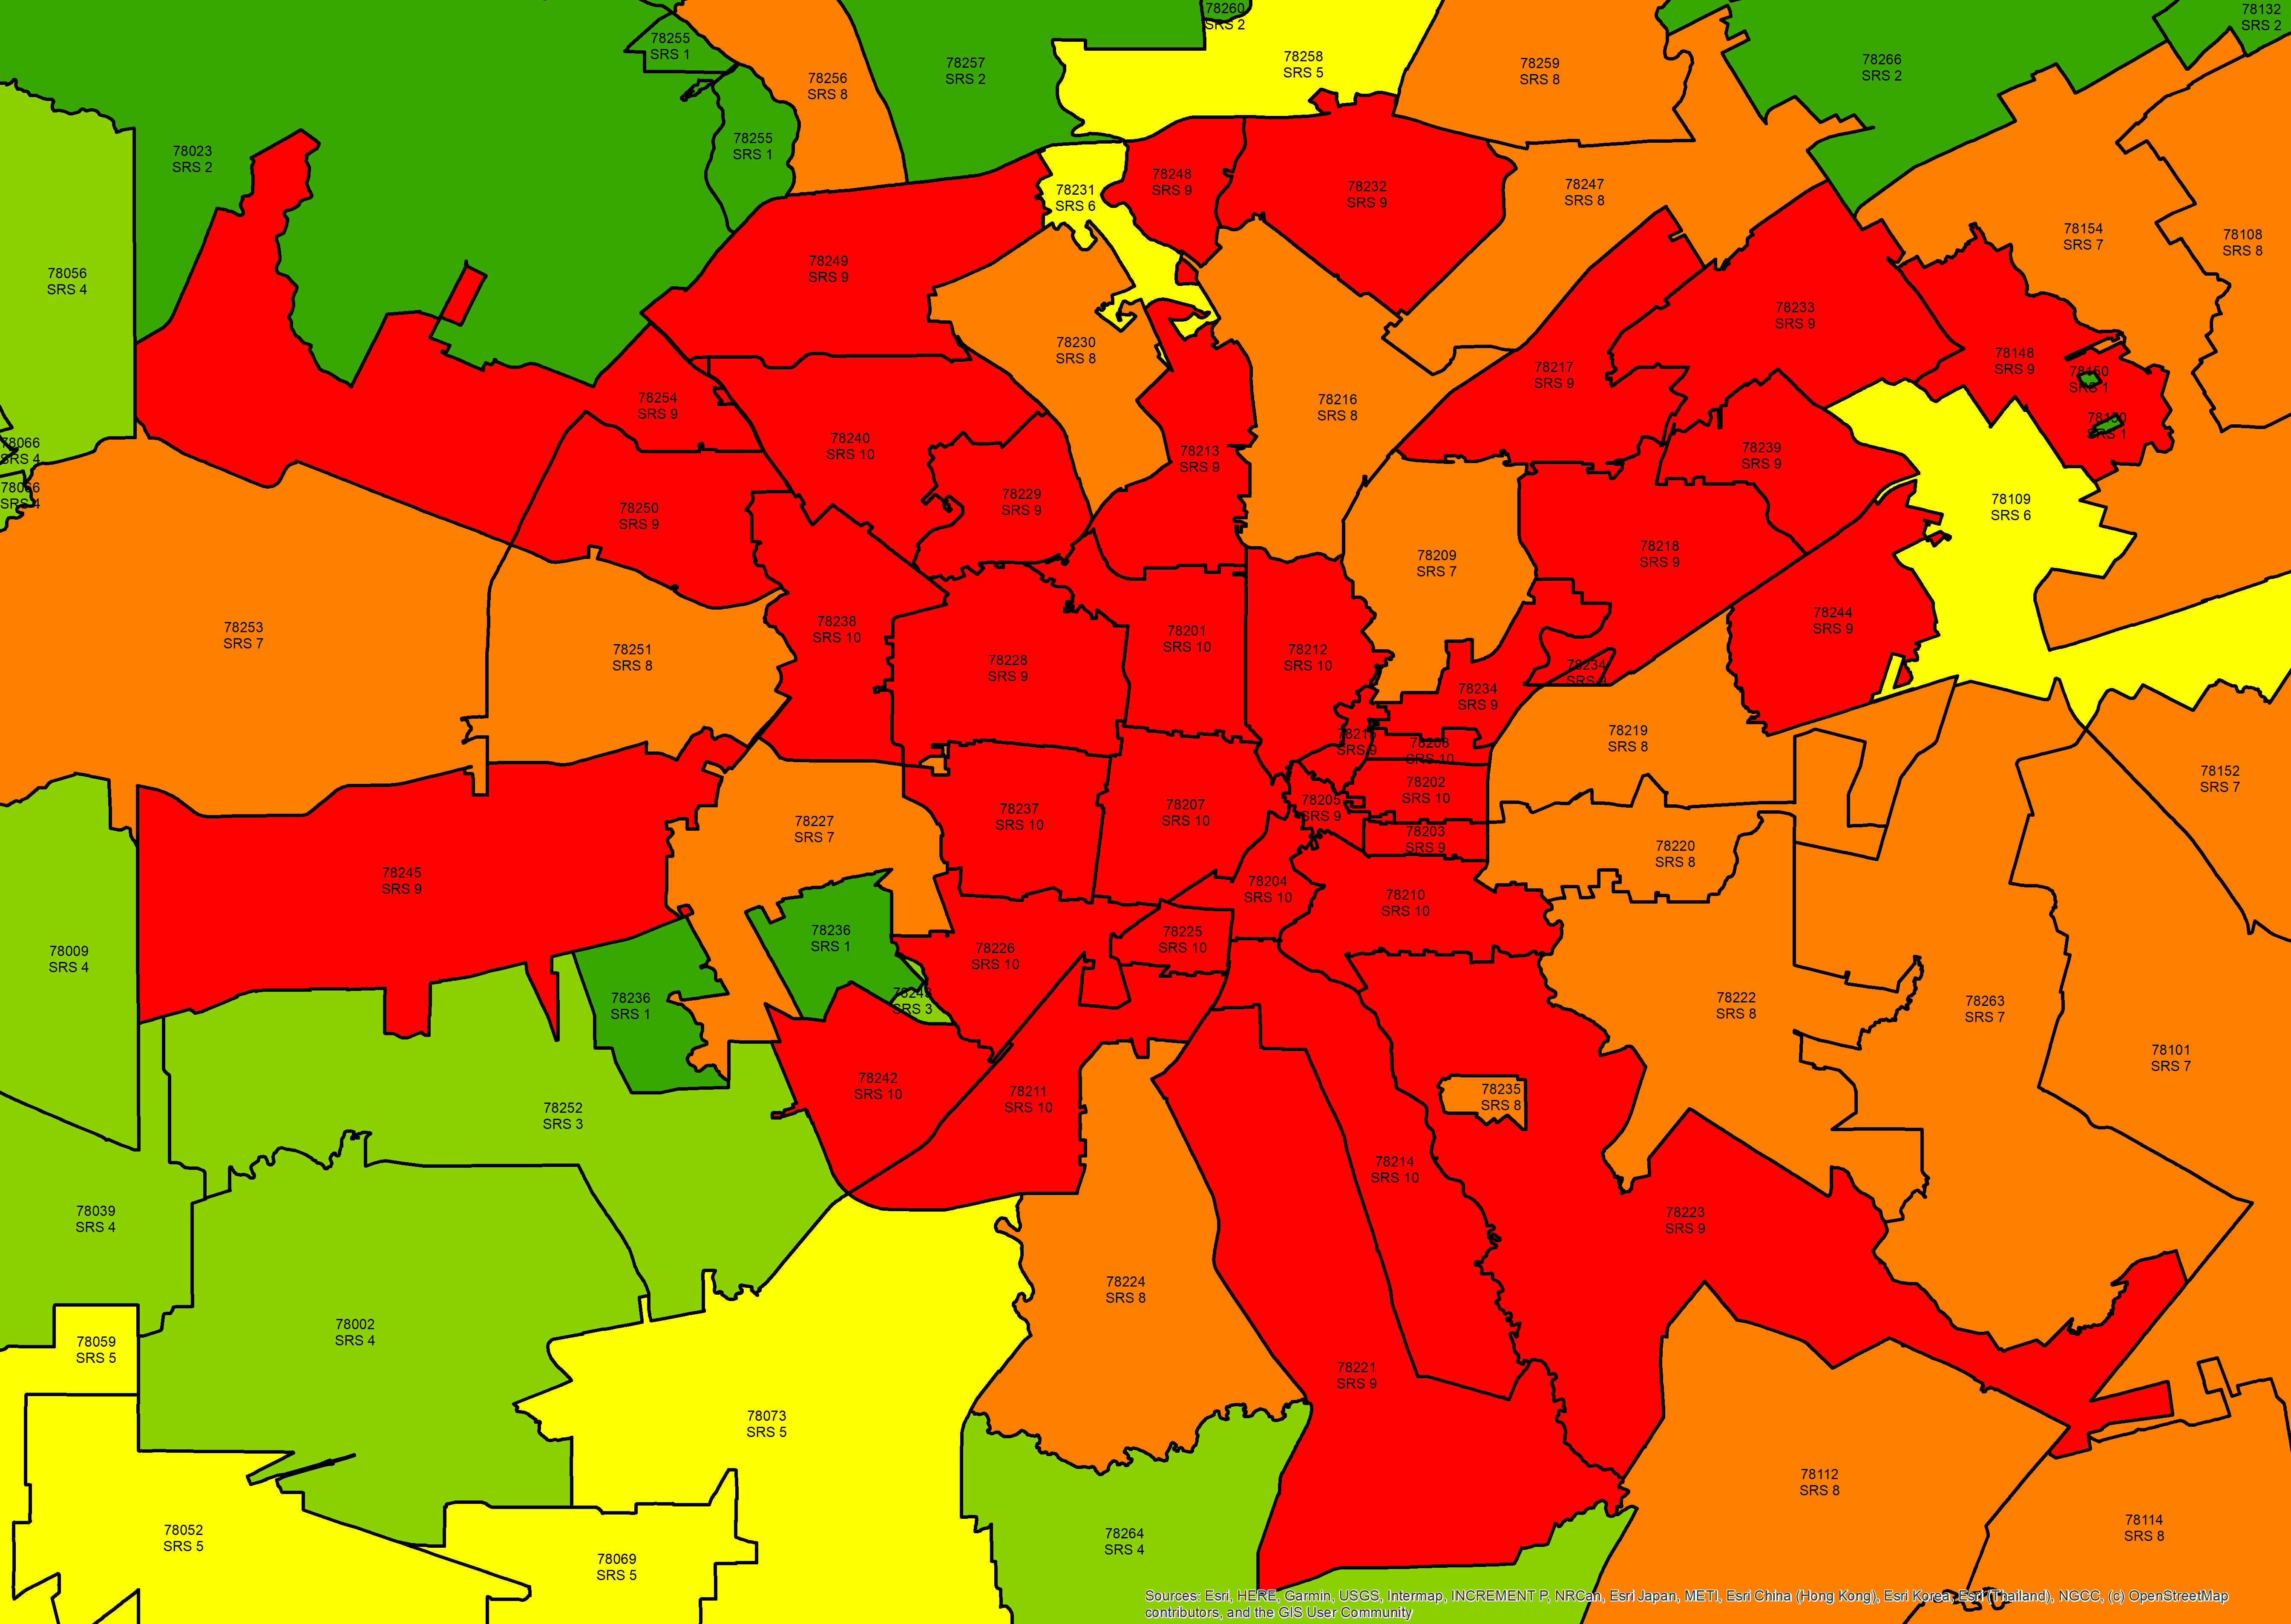
Zip Level