Spatial Risk Scores
Introducing SRS Geospatial Risk Scores
Spatial Risk Systems introduces the SRS Spatial Risk Scores, designed to measure risk at the location level. The SRS Risk Scores are calculated at the census tract, county, and postal code levels, or on a user-defined geographic area.
Spatial Risk Scores measure the exposure to location-specific factors that have a long-term effect on asset value, environmental impact, operational effectiveness, and social sustainability.
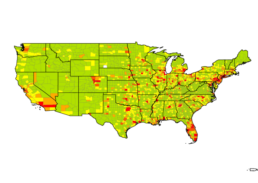
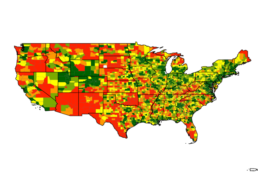
SRS National Risk Scores
Spatial Risk Scores measure the exposure to location-specific factors that have a long-term effect on asset value, environmental impact, operational effectiveness, and social sustainability.
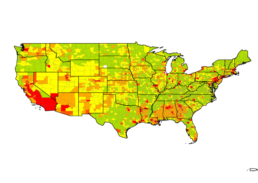
SRS State Risk Scores
The SRS Risk Score further predicts the toll the event will have on a location by focusing on the extreme yet predictable effects of climate disasters. Will the population and the assets recover after the initial event, or will demographic and socioeconomic factors force a permanent change? We are assuming an asset that takes 10 or more years to recover is permanently altered. The scores are also a leading indicator of what might be expected from an environmental disaster.
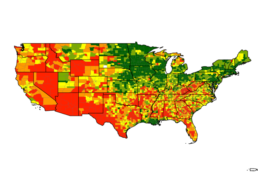
SRS County to Corporate Risk Scores
Using a methodology similar to the one described in the National Risk Index Primer, SRS quantifies risk to determine likely outcomes when a catastrophic event occurs, but with a few fundamental changes[1]. The Risk Scores are divided into ten risk bands where SP1 is the least risky and SP10 the most severe.
Scores measure the impact of the climate, environment and socio-economic factors on asset locations.
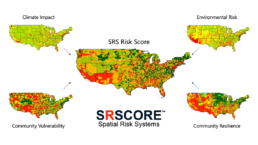
Each SRS Risk Score carries with it the interaction of location, climate, environmental, demographics, vulnerability, and resilience to better understand the risk to assets and population
Local environmental conditions such as air quality, proximity to dangerous, unsafe, and toxic release sites are distributed unevenly across the States. Understanding the interplay of these factors brings us to the root of Spatial Risk.
Investors, risk managers, and municipalities need to understand where their assets and communities fall on this spectrum. Are they located in areas where magnifiers or mitigators of risk exist?
The SRS Risk Scores enable us to understand, in advance, the unique mix of risk magnifiers and mitigators, which can so profoundly affect an outcome when the area comes under pressure.
Our review of natural disasters and their outcome has shown that while the risk factors were often identified, they were not quantified to measure the overall spatial risk. The SRS Risk Scores are designed to start that conversation.

Climate Natural Disaster
- Agricultural/Crop Value Exposure
- Expected Annual Loss Score
- Total Estimated Annualized Loss
- SRS Climate Impact Score
- Building Value Exposure
Carbon Risk Emissions
- CO2 Emissions, Scope 1
- Social Cost of Carbon Scope 1
- CO2 Emissions, Scope 2
- Social Cost of Carbon, Scope 2
- CO2 Emissions, Total
- Social Cost of Carbon Total
- Carbon Transition Risk Scores (National and State Levels)
Socio-Economic Vulnerability
- People of Color
- Low-income
- Less than High School
- Individuals in linguistic isolation
- Under the age of 5
- Over age 64
- Pre-1960 housing (lead paint indicator)
- Index (based on 2 factors, % low-income and % people of color)
Socio-Economic Resilience
- Human well being
- Economic Financial Outlook
- Infrastructure