Alexander Vengerovsky, Chief Data Scientist
February 7th, 2023
The SRS Spatial Risk Model uses three main sources:
➢ FEMA National Risk Index (NRI) dataset provides Estimated Annualized Losses as well as assessments of the Community Vulnerability and Resilience on the Census Tract level. More information about NRI data is available here: Data Glossary | National Risk Index (fema.gov)
➢ US EPA Environmental Justice (EJSCREEN) dataset provides data describing variety of detrimental environmental conditions on the Census Block Group and Census Tract levels. More information about EJSCREEN indices and data is found here: EJ and Supplemental Indexes in EJScreen | US EPA
➢ Several cross-walk datasets capturing relationships between different geographic entities such as Census Tracts and City Boundaries, Census Tracts and ZIP Code Tabulation Areas, etc.
We will illustrate the innerworkings of the model by stepping through the construction of the SRS Spatial Risk Score for the city of Denver, Colorado.
Before we go further it is important to introduce certain key data concepts contributing to the spatial risk assessment.
- Natural Hazards. NRI methodology considers 18 different natural hazards, such as Avalanches, Heat Waves Hurricanes, etc. See Addendum for the full list.
- Estimated Annualized Losses (EAL). According to NRI documentation, the EAL for each Census tract or county is the average economic loss in dollars resulting from natural hazards each year. EAL is computed for each hazard type and only quantifies loss for relevant consequence types (i.e., buildings, population, or agriculture).
- Community Vulnerability is broadly defined as the susceptibility of social groups to the adverse impacts of natural hazards, including disproportionate death, injury, loss, or disruption of livelihood. Community Vulnerability considers the social, economic, demographic, and housing characteristics of a community that influence its ability to prepare for, respond to, cope with, recover from, and adapt to environmental hazards
- Community Resilience is defined by National Institute of Standards and Technology (NIST) as the ability of a community to prepare for anticipated natural hazards, adapt to changing conditions, and withstand and recover rapidly from disruptions.
- Environmental risk Indicators. EJSCREEN dataset includes 12 environmental indicators that reflect detrimental effects of the dangerous environment conditions on human health, such as proximity to hazardous waste sites, poor air quality, concentration of diesel particles in the air, etc. See Addendum for the full list.
Aggregating Source Data
The information about cities and towns is captured in two US Census concepts: County Subdivisions and Census Places. Census Tract and Block Group boundaries may often cross the boundaries of County Subdivisions, Places, and other Census spatial concepts. To reasonably accurately aggregate Census Block Group and Tract level data at County Subdivision and Census Places level we built a mapping file which describes the relationships between Census Tracts, Subdivisions and Places. This mapping file associates cities and towns with one or more Census Tracts. Using this mapping file makes aggregation straightforward.
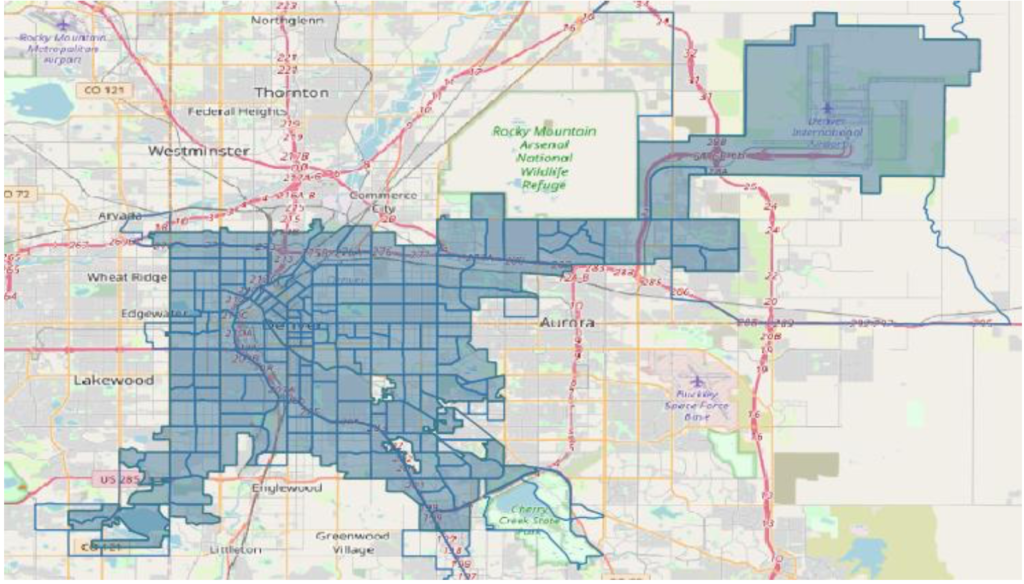
Step 1. Aggregating granular source data at the City of Denver level.
Denver city area includes Denver International Airport intersects with 200 Census Tracts (see the picture below), but 68 Census Tracts have only a minimal intersection with the city and therefore these Census Tracts are excluded from the aggregation.
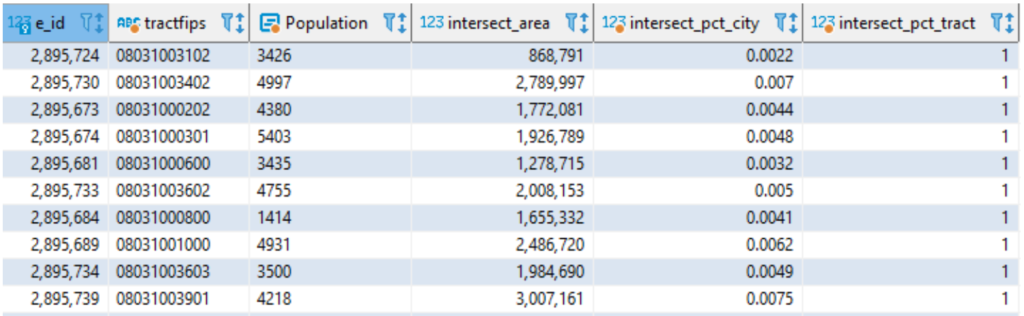
The table below shows a partial list of the Census Tracts comprising the City of Denver with Population and intersect area figures.
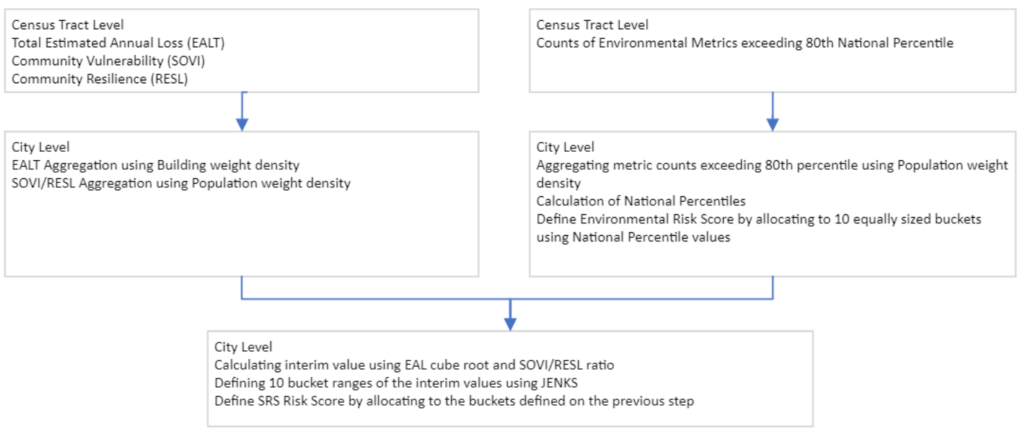
High Level View at the Process for
Calculating SRS Risk Score at the City Level
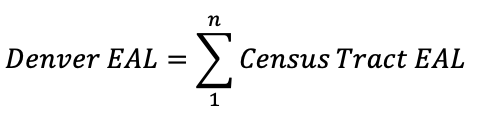
Aggregation Logic for the Estimated Annualized Loss
- Simple aggregation method applies all Estimated Annualized Loss (EAL) components, such as Buildings, Agriculture and People across all environmental hazards:
2. Population Weighted Density method applies to the Community Vulnerability (SOVI) and Community Resilience (RESL) factors:
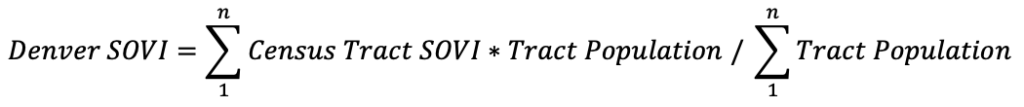
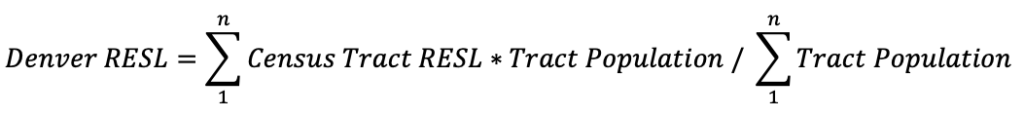
, where n = number of Census Tracts comprising City of Denver.
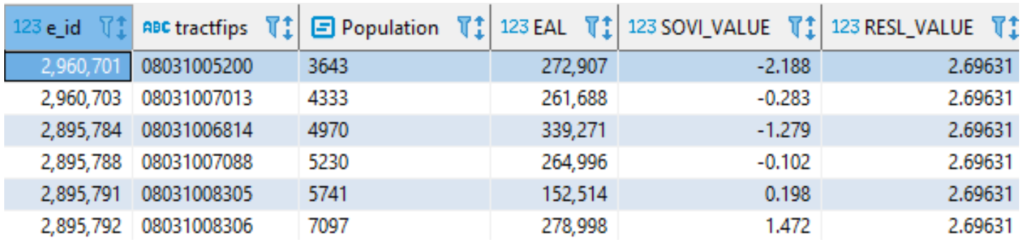
For illustration, we show a partial listing of Census Tracts with their EAL, SOVI and RESL values.
… and EAL, SOVI and RESL values for city of Denver after aggregation
Calculating Climate Risk Scores at the Census Tract Level
To assess the Climate Risk on the Census Tract level we adopted NRI methodology. The Census Tract Climate Risk Score is calculated in two steps:
- Expected Annual Loss Score is a cube root of the Total Estimated Annual Loss calculated as a total sum of all EAL from all the hazards the area is exposed to and then adjusted by min/max normalization while maintaining the value within 0-100 range. According to NRI methodology, “EAL values are heavily skewed by an extreme range of population and building value densities between urban and rural communities. To account for this, a cube root transformation is applied before min-max normalization. By applying cube root transformation, the National Risk Index controls for this characteristic and provides scores with greater differentiation and usefulness. If the minimum value of the EAL is a nonzero number before normalization, an artificial minimum is set to 99% of that value so that communities expected to experience loss do not receive a 0 EAL score”
- The Total Estimated Annual Loss Score is then adjusted by the ratio of Community Vulnerability and Resilience
- The resulting values are then distributed across 10 buckets. The bucket ranges are determined by JENKS algorithm. The bucket number becomes a Climate Impact Score (CIS).
This process is repeated for each of the climate related hazards.
Aggregating Climate Risk Scores at the Higher Spatial Levels
- Climate Impact Scores of the higher spatial levels are calculated using Building Value weighted density as the proxy for the magnitude of the impact of the climate related disasters, e.g. for Hurricanes in the Denver area:
…where n is the number of Census Tracts comprising the City of Denver. This calculation is performed for each of the climate related hazards.
2. Total Climate Impact Score is sum of the individual hazard CIS calculated on the previous step, using Total Estimated Annual Loss weighted density.
…where n – number of climate related hazards applicable to the Census Tract.
3. Community Vulnerability and Resilience Scores of the higher spatial levels are calculated using Census Tract Population Value weighted density.
…where n – number of climate related hazards applicable to the Census Tract.
…where n is the number of Census Tracts comprising the City of Denver.
Aggregation Logic for the Environmental Risk Indicators
Population Weighted Density method applies to each of the Environmental Risk Indicators (see the list in Addendum):
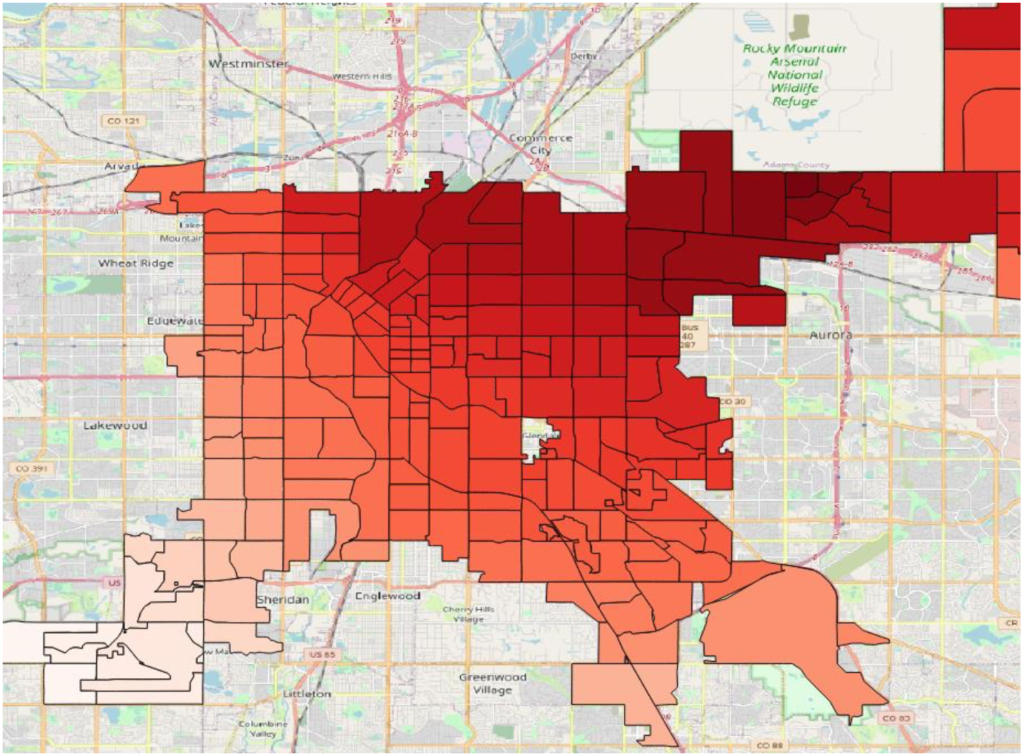
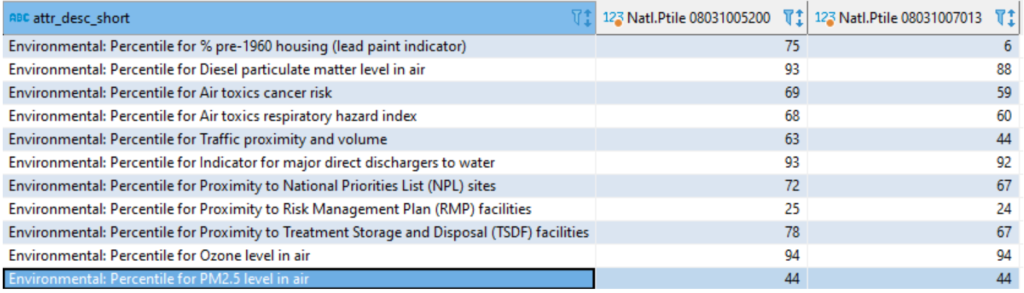
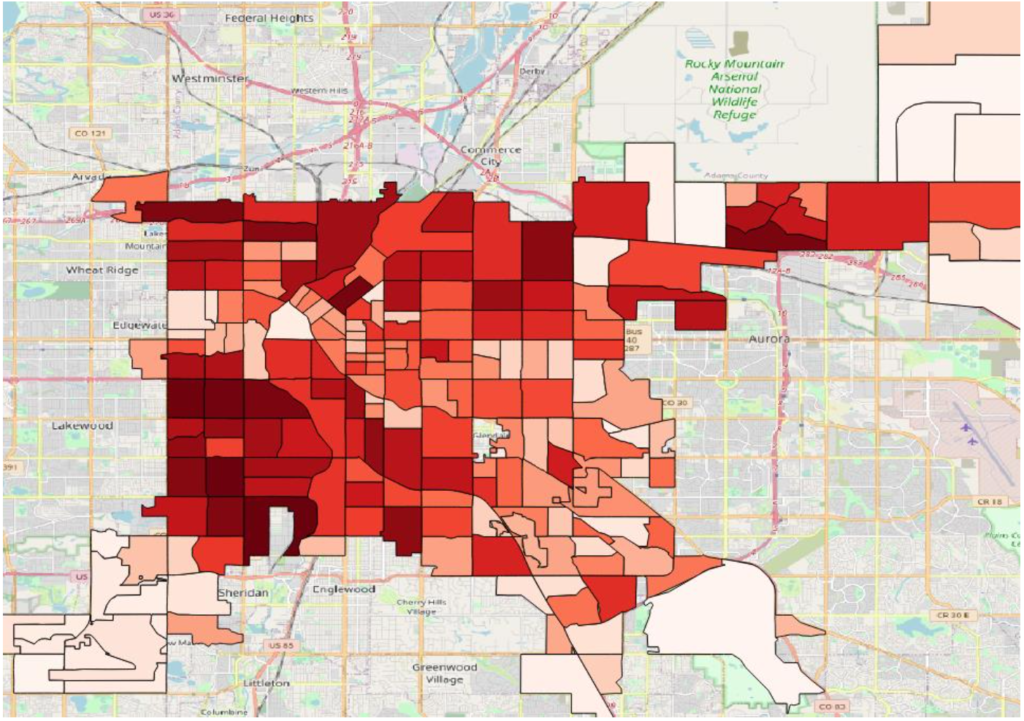
We also calculate the National and State level percentiles for each of the 11 Environmental Indicators. The picture below shows the distribution of National Census Tract level PM 2.5 percentiles in the City of Denver. These percentiles will be used in the next step of the process. As an illustration, the table below shows National percentiles for all Environmental Indicators for two Census Tracts in Denver area.
Aggregation Logic for Total Environmental Impact
To assess the risk of the adverse Environmental factors on the population health we consider a total number of the Environmental Indicators exceeding 80th National percentile as a proxy. We also assume that the total impact of adverse conditions is very likely proportional to the population of the area. With these assumptions, we calculate a product of the total number of the Environmental Indicators exceeding 80th National percentile for the Census Tract by the Census Tract population. This metric is called the Total Environmental Impact (TEI).
𝑇𝐸𝐼 = 𝑁𝑢𝑚𝑏𝑒𝑟 𝑜𝑓 𝐸𝑛𝑣𝑖𝑟𝑜𝑛𝑚𝑒𝑛𝑡𝑎𝑙 𝐼𝑛𝑑𝑖𝑐𝑡𝑜𝑟𝑠 > 80𝑡h 𝑝𝑡𝑖𝑙𝑒 ∗ 𝑇𝑟𝑎𝑐𝑡 𝑃𝑜𝑝𝑢𝑙𝑎𝑡𝑖𝑜𝑛
The picture below reflects the TEI distribution for the City of Denver.
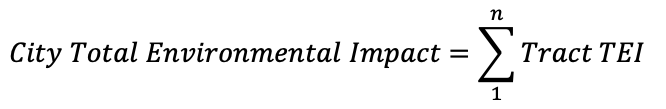
Since the size of the population has been already accounted for in TEI calculation, we apply a simple aggregation to arrive at the city level Total Environmental Impact (CEI).
The resulting metric is then distributed across 10 roughly equal groups and the group number is called Environmental Risk Score and it will be used going forward as a component for the overall SRS Risk Score calculation.
SRS Risk Score Calculation
SRS Risk Score assesses a total impact of both climate and environmental factors on the territory (Census Tract, Count, City, Zip Code Tabulated Area, School District, etc. ).
Step 1. We calculate a product of Total Estimated Annual Loss Score multiplied by Environmental Impact Score and then adjust by the ratio of Community Vulnerability and Resilience factors.
Step 2. The resulting values are then distributed across 10 buckets. The bucket ranges are determined by JENKS algorithm. The bucket number becomes a SRS Risk Score.
About Spatial Risk Systems:
SRS is a data connectivity company focused on spatial finance. We have created a multi-tier data map showing where physical economic activity takes place on a global basis and have connected this to key risk factors and open data sets in the form of a knowledge graph.
Alex previously spent the past 12 years focused on all things data at the Westport, CT based hedge fund, Bridgewater Associates.
Spatial Finance is a way to unify geospatial-climate, socio-economic, entity relationship and other data sources to use for operational assessment, risk management, portfolio/index construction and variety of other business decisions. The resulting highly connected and consistent data structure is known as a Knowledge Graph.
Tags: SRS, Spatial Finance, Utilities, Knowledge Graph, Utilities Index
For more information, please visit SRS’s web site or email [email protected]