
Using US Energy Information Administration (EIA) Data
EIA is the statistical and analytical agency within the U.S. Department of Energy. EIA produces energy data and analysis to provide context for how a variety of energy industries serve customers in the United States and abroad. EIA vast database is available for public use. EIA data, as well as many other connected data sets, is available as part of the SRS Knowledge Graph.
US Energy Balance by Power Source
United States generates about four thousand TERA Watt hours of electrical power a year.

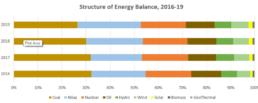
While the ‘fossil’ power sources (Coal, Oil and Natural Gas) remain dominant in the US energy balance accounting together for 63-67% of the US energy production their share is gradually getting smaller while the share of renewable sources (Wind and Solar) is increasing.
Nuclear and Hydro power generation remains stable 18 and 12% respectively. There is also a sizeable shift within ‘fossil’ group: the material capacity shift from Coal to the Natural Gas. Below we will examine in details both structural changes.
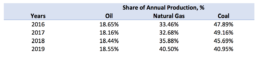
Moving from Coal to cleaner Natural Gas
From 2016 thru 2019 the country has shifted about 7% of the power generating capacity from coal to the cleaner source – natural gas.
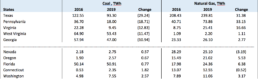
Where this change is taking place?
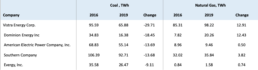
Texas, Pennsylvania, Virginia, West Virginia, and Georgia are 5 top states driving the transition from Coal to the Natural Gas. The table below shows the changes in terms of electricity generation volume (TWh). Together they moved over 27% of their combined electrical generation from Coal to the Natural Gas in 4 years. At the same time Nevada, Oregon, Florida, Connecticut and Washington added Coal-based generation.
ANALYSIS
Who is driving the change from Coal to the Natural Gas?
It appears that private industry (investor-owned, independent) is ahead of publicly-owned or mixed-ownership utilities.
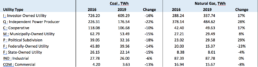
Here are the five top private utilities that lead the industry by reducing their exposure to Coal and moving at least some of their generation capacity to the cleaner source – Natural Gas.
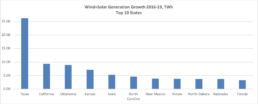
Let us turn our attention to renewables: in four years (2016-19) the electricity generation from Wind and Solar sources has significantly grown.
While in absolute numbers the generation from Wind and Solar has yet to reach the levels produced by ‘fossil’ fuels the trend is steep and clear. During these years the generation from Solar has doubled and from Wind increased by 30%.
Texas, California, Oklahoma, and Kansas lead.
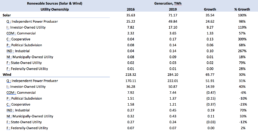
Who is driving the growth in renewable sources?
The growth of the renewable sources is driven predominantly by independent producers while federal, state-owned, and municipal utilities are lagging in terms of generation capacity and growth.
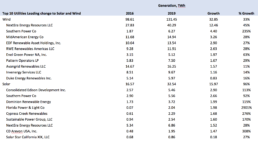
On a more granular level...
NextEra Energy Resources and Southern Power look like clear leaders in driving the move to use more renewable sources (Wind and Solar) in terms of absolute generation capacity
Constructing Hypothetical Portfolios
There is a hypothesis that market would reward companies that have capabilities and incentives to drive the change to a more sustainable and cleaner energy generation. We would like to evaluate this hypothesis using the findings from this study.
As the first step let us look at the publicly traded utilities and understand how their balance of power sources has changed over the last 4 years (2016-19). We identified 23 publicly traded utilities leading the industry in terms of total electricity generations and examined their power sources. Our list contains well known names like: Duke Energy, Dominion Energy, Exelon, etc. These companies account for roughly 50% of US electricity generation.
We then organized these companies into 3 groups (portfolios) based on their contribution in terms of generating capacity to both significant structural changes: a) shift from Coal to the Natural Gas and b) Solar and Wind growth.
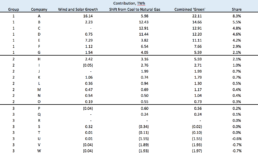
Our expectation was that in terms of market performance over the long term our Group 1 will deliver better returns than Group 2, and Group 2 will outperform Group 3. We then would compare the market performance of our portfolios to the benchmark – S&P Utilities Index (.GSPU).
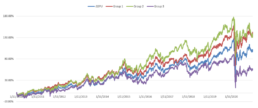
As can be seen from the chart below, our Group 1 fared by and large on par with our Group 2 and both Group 1 and Group 2 have significantly outperform Group 3 and the benchmark. Our analysis did not account for the dividend adjustments, therefore the actual returns will be materially higher than presented here.
Performance of our hypothetical portfolios vs S&P Utility Index. Simple returns. 2010-2020
CONCLUSION
We used SRS connected data for this case study. It made many data “massaging” and calculation tasks fast and easy because SRS has already addressed many integration and data quality issues freeing users from mundane and time-consuming tasks.