
The case at hand explores the risks in the areas where there is a significant concentration of the manufacturing sites contracted by US Government to produce personal protection devices (PPD), medical equipment, test kits and other materials to combat COVID-19 pandemic. We used various healthcare and socio-demographic factors to understand the potential risks to the delivery of products manufactured in this area by spatially connecting metrics from various open sources with the locations of the manufacturing sites and healthcare deliver centers (hospitals).
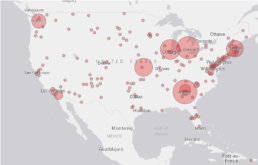
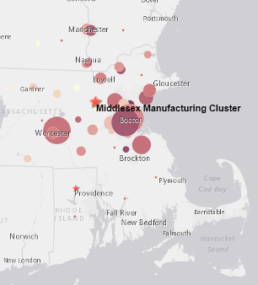
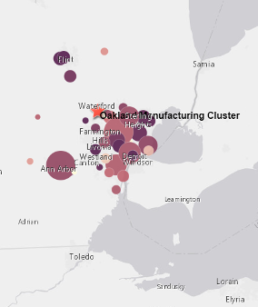
The map below shows manufacturing sites for the major recipients of US Government awards funded by CARES act and other authorizations dealing with the current pandemic. Award amounts indicated by the size of the circles. In this use case we focused on three manufacturing clusters: De Kalb, GA, Oakland MI and Middlesex, MA and will spatially connect with these locations several datasets containing various healthcare, epidemiological and socio-economic factors.

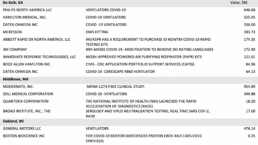
As you can see from the table below the companies contracted by the government are producing some of the most important products and components to fight the epidemic. Given this It appears relevant to understand the COVID-19 related risks that could negatively impact their ability to deliver and the ability of existing healthcare infrastructure to manage the situation.
We used the data from Robert Wood Johnson Foundation which collected and aggregated 34 various factors on a county level throughout United States to understand both Health Outcomes and Health Factors significantly influencing the outcomes. Since the production staff’ commute to work will likely be within 1 hour driving distance we expanded the area of focus to include counties surrounding the manufacturing clusters in focus.
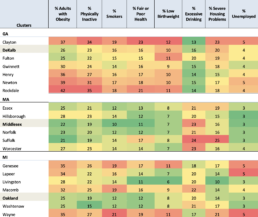
As RWJ warns using their aggregated metrics to compare health outcomes and factors across state lines may be inaccurate due to methodological differences in norms and data collection rules. That is why we did not use the aggregated metrics but rather selected and looked at eight most heavily weighted factors adversely impacting the health outcomes (see the table below).
Seven out of eight factors for Massachusetts cluster of counties are consistently better indicating that the people in MA cluster is relatively healthier than people in Georgia and Michigan clusters.
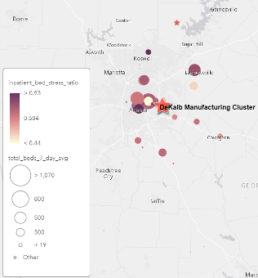
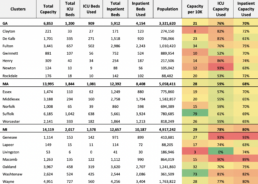
Given the importance of hospital services in the pandemic context we wanted to understand the existing hospital system capacity and the current utilization level. We connected our manufacturing sites dataset with the Hospital Data Coverage Report published weekly by HHS. This report contains overall bed capacity utilization and various inventory slices (inpatient, pediatric, ICU). To make the data comparable we normalized the data by producing a ratio of available certified beds per 10K of population and inpatient and ICU bed capacity.
The normalized ratios (Capacity per 10K, ICU Capacity Used and Inpatient Capacity Used) are consistent with the situation painted by RWJ metrics – MA cluster overall is in a relatively better condition than MI and GA clusters.
De Kalb, GA
Middlesex, MA
Oakland, MI
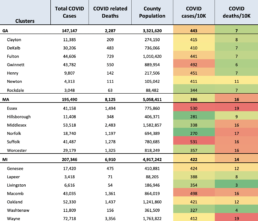
And, finally, we connected the dataset published by CDC containing the number of COVID cases and COVID related deaths on a county level. Using this dataset, we produced COVID mortality rates (number of deaths per 10K population). By looking at normalized case and mortality rates we can assess the relative severity of the crisis across our clusters (see table below).
The relatively lower COVID case rate in MA cluster looks consistent with the overall assessment of health based on RWJ data. However, MA cluster apparently experienced meaningfully higher death rate.
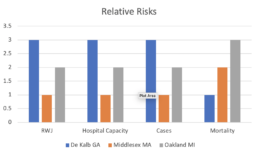
The picture by and large looks consistent across the dimensions we considered:
The overall relative healthcare related risks for manufacturing in MA cluster appear to be the lowest, followed by Michigan and Georgia.
The chart below summarizes the conclusions across each of the risk dimensions.
Obviously, these analyses can be and should be questioned as we examined the latest available data snapshot and limited number of factors in a static situation, i.e., without considering the dynamics.
We used SRS connected data for this case study. It made many data “massaging” and calculation tasks fast and easy because SRS has already addressed many integration and data quality issues freeing users from mundane and time-consuming tasks.