Ken Zockoll, CEO, Spatial Risk Systems
February 8th, 2023
If one looks at the current state of the financial data ecosystem, there are four critical factors in play from a data governance perspective.
1. Issuers/Counterparties
2. Security Level (ISIN, CUSIP, Loan Identifiers….)
3. Listing Level (Exchange Code/Ticker Symbol, SEDOL…)
4. Point in Time (i.e., Time Series – Daily Pricing, Transactions, News….)
Traditional data sets such as pricing, estimates, and fundamentals leverage traditional industry security/level standards such as tickers, SEDOL, and CUSIP numbers to represent securities and companies. As financial data has expanded to include non-traditional data sources (i.e., alternative data), the traditional security level identifiers are not fit for purpose to support these new alternative data sets that generally ‘live’ at an issuer/entity level and, in many cases do not issue publicly traded securities. The lack of standards makes it difficult to incorporate or connect these sources with standard data sets. Several solutions are now in place at the issuer level, from industry-promoted standards (LEI) to vendor solutions.
From an enterprise data governance perspective, entity-level resolution/disambiguation is the strategic lynchpin to effectively connect and manage traditional and alternative data sets.
To date, no comprehensive data set tracks and organizes corporate, government, or counterparty asset locations. In addition to tracking legal hierarchies and
supplier relationships, it is becoming essential to understand where companies operate on a ‘spatial level’ to quantify the exposure to location-specific factors that haveshort-term andlong-termeffects on asset values, environmental impact, operational effectiveness, and social sustainability.
Tracking and quantifying this spatial layer risk is an emerging concept known as Spatial Finance. To understand how a company operates from an environmental sustainability perspective, you need to map its global operational footprint and interaction with its local geographic environments. Do they pollute? Are there toxic releases? What are the local factors around that facility from a community health perspective? How does the asset location interact with the local community? How will climate impact long-term operating effectiveness?
Climate Impact and environmental risk are having a material change on how investors now see the global playing field.
Founded by data science leaders from the financial sector, Spatial Risk Systems (SRS) quantify risk (geographical or facility) levels, unifying and standardizing hundreds of empirical data sources in helping investors understand ESG and sustainable investing outcomes from a facility or jurisdictional level perspective. The current state of ESG reporting struggles to deliver these ground-Level truths.
In addition to the four essential data governance attributes mentioned earlier, SRS Knowledge Graph now adds a spatial layer to the existing data ecosystem, seamlessly connecting asset locations to public, private and governmental entities, their financial identifiers (i.e., ISIN, Ticker, etc..) and relevant climate, environmental and socioeconomic factors.
- Issuers/Counterparties
- Security Level (ISIN, CUSIP, Loan Identifiers….)
- Listing Level (Exchange Code/Ticker Symbol
- Point in Time (i.e., Time Series – Daily Pricing, Transactions, News….)
- Point in Space (location-specific factors impacting investment and operational outcomes)
The SRS Spatial Graph
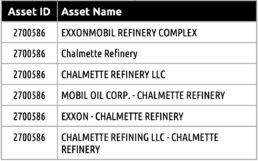
3.7 Million+ Asset Locations

Multiple Name Support for a Given Asset Location to Fully Support Entity Name Resolution and Disambiguation
Single Attribute File
The power of knowledge graphs – Unifying hundreds of spatial level data sets under a single set of standards
- 39,000+ Unique Attribute Types
- 4.1 Billion+ Attribute Values
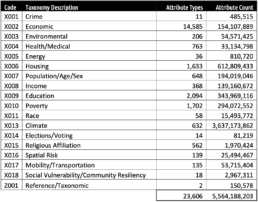
Extensive Classification Taxonomy - 1,700+ Categories
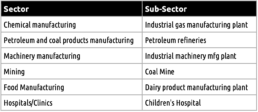
Selected Categories
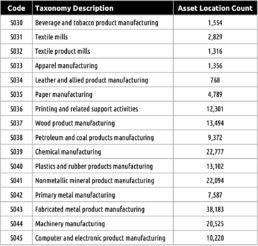
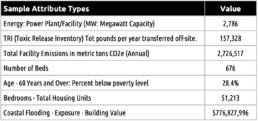
The ability to map relevant facility-level or geographic-level data to an asset location enables thousands of data points (Points in Space) to be quickly aggregated and exposed at an issuer level for risk analytics, reporting, and data science purposes.
This example looks at the two asset locations and their associated identifiers. Behind these identifiers are thousands of factors and attributes associated with the facility and the local area.
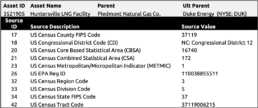
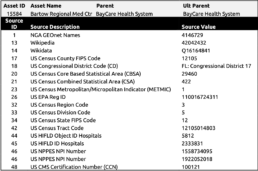
One of the foundational pieces of the SRS spatial graph is the full support of a global geo- hierarchy. The SRS geo-hierarchy allows new data sets to be quickly onboarded in a matter of hours and not weeks and have these factors quickly exposed via SRS’ single fact table. Most available data sets are published at a geographic or geopolitical level.
16 Levels are Supported
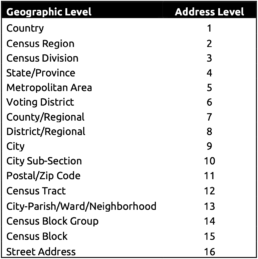
The other benefit of this approach is data can be quickly aggregated at any one of the following geographic levels:
About Spatial Risk Systems:
SRS is a data connectivity company focused on spatial finance. We have created a multi-tier data map showing where physical economic activity takes place on a global basis and have connected this to key risk factors and open data sets in the form of a knowledge graph.
Spatial Finance is a way to unify geospatial-climate, socio-economic, entity relationship and other data sources to use for operational assessment, risk management, portfolio/index construction and variety of other business decisions. The resulting highly connected and consistent data structure is known as a Knowledge Graph.
Tags: SRS, Spatial Finance, Utilities, Knowledge Graph, Utilities Index
For more information, please visit SRS’s web site or email support@spatialrisksystems.com
