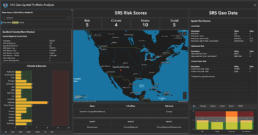
Mitigate Climate Risk
Geospatial Insight & Analytics
Corporate Asset Class
With over 50,000 Public and Private Issuers, 900,000 asset locations. SRS provides a turn-key solution illuminating hundreds of key factors ...
US Municipal Asset Class
With over 270 risk factors and resilience indicators, including historical severe storm related damages going back to1950, SRS helps investors, underwriters and issuers understand the cost of capital from a spatial risk perspective for counties, cities, agencies and special districts.
Insurance
Comprehensive data solution for underwriters, brokers, and carbon credit trading. 270 Risk Factors tracked down to Facility and Census Tract Levels....
Supply Chain
SRS data helps business managers understand location-specific vulnerabilities in their supply chains, mitigate risks and identify alternatives
Financial Institution Stress Testing
SRS spatial-level knowledge graph solution provides a comprehensive picture Physical Risk Exposures, Environmental Impacts, Expected Annual Losses, and weather event history with $ damages back to 1950.
Real Estate Development | Investing
SRS Spatial Knowledge Graph helps anyone involved in real estate development, investment and site selection by integrating dozens of relevant data sources and thousands of location-specific attributes with a specific point on the map by providing a simple turn-key solution.
AI Training Data Sets
Much has been written about how knowledge graphs are foundational to AI, Large Language Models, and generative AI. In SRS’ spatial-level knowledge graph where every data point is connected to any other data point is a major source for fact-based training sets. No fabricated data. Real Facts.
Power Generation
Global Electricity Grid. Drive Site/Data Center Selection. 80,000+ Power Plants (Fossil Fuels, Renewables, Nuclear), Name Plate Capacity, Utilization Rates, Carbon Intensity Ratios and Scope II Emissions. 100,000+ Substations
Physical Risk/Peril Types
- Avalanche
- Coastal Flooding
- Cold Wave
- Drought
- Earthquake
- Hail
- Heat Wave
- Hurricane
- Ice Storm
- Landslide
- Lightning
- Riverine Flooding
- Strong Wind
- Tornado
- Tsunami
- Volcanic Activity
- Wildfire
- Winter Weather
Environmental Factors
Air Quality
Water Quality
Toxic Materials
Carbon/Methane Emissions
Socio-Economic Risk Factors
- Race
- Income/Wealth
- Poverty
- Education
- Age Demographics
- Housing
- Business Establishments by Industry and Employee Counts
- Economic Factors
- + More

